See more : Atlas Engineered Products Ltd. (APEUF) Income Statement Analysis – Financial Results
Complete financial analysis of Medley Management Inc. (MDLY) income statement, including revenue, profit margins, EPS and key performance metrics. Get detailed insights into the financial performance of Medley Management Inc., a leading company in the Asset Management industry within the Financial Services sector.
- Ibstock plc (IBJHF) Income Statement Analysis – Financial Results
- Public Joint Stock Company “Rollman Group” (RLMN.ME) Income Statement Analysis – Financial Results
- Xinjiang Korla Pear Co.,Ltd (600506.SS) Income Statement Analysis – Financial Results
- Baron Oil Plc (BOIL.L) Income Statement Analysis – Financial Results
- Zhejiang XiaSha Precision (001316.SZ) Income Statement Analysis – Financial Results
Medley Management Inc. (MDLY)
About Medley Management Inc.
Medley Management, Inc. provides investment management services. The company is headquartered in New York, New York and currently employs 76 full-time employees. The firm operates in the investment management segment. The company is focused on credit-related investment strategies, primarily originating senior secured loans to private middle market companies in the United States. The firm generally holds these loans to maturity. Its national direct origination franchise provides capital to the middle market in the United States. The firm has over $4.8 billion of assets under management (AUM) in approximately two business development companies (BDCs), Medley Capital Corporation (MCC) and Sierra Income Corporation (SIC), as well as private investment vehicles. The company has over $5 billion of AUM. The firm provides capital to over 300 companies across approximately 35 industries in North America. The firm's long-dated private funds include MOF I, MOF II and MOF III. Its private funds are managed through partnership structures
| Metric | 2020 | 2019 | 2018 | 2017 | 2016 | 2015 | 2014 | 2013 | 2012 |
|---|---|---|---|---|---|---|---|---|---|
| Revenue | 33.25M | 48.84M | 56.51M | 65.56M | 76.03M | 67.43M | 72.17M | 43.87M | 28.24M |
| Cost of Revenue | 21.52M | 28.93M | 31.67M | 26.56M | 27.48M | 18.72M | 18.78M | 20.90M | 16.63M |
| Gross Profit | 11.73M | 19.92M | 24.84M | 39.00M | 48.55M | 48.71M | 53.39M | 22.97M | 11.62M |
| Gross Profit Ratio | 35.28% | 40.78% | 43.96% | 59.49% | 63.85% | 72.24% | 73.98% | 52.35% | 41.13% |
| Research & Development | 0.00 | 0.00 | 0.00 | 0.00 | 0.00 | 0.00 | 0.00 | 0.00 | 0.00 |
| General & Administrative | 0.00 | 17.19M | 19.37M | 13.05M | 28.54M | 16.84M | 17.98M | 13.88M | 11.33M |
| Selling & Marketing | 0.00 | 0.00 | 0.00 | 0.00 | 0.00 | 0.00 | 0.00 | 0.00 | 0.00 |
| SG&A | 0.00 | 17.19M | 19.37M | 13.05M | 28.54M | 16.84M | 17.98M | 13.88M | 11.33M |
| Other Expenses | 16.44M | 0.00 | 0.00 | 0.00 | 0.00 | 0.00 | 0.00 | 0.00 | 0.00 |
| Operating Expenses | 16.44M | 17.19M | 19.37M | 13.05M | 28.54M | 16.84M | 17.98M | 13.88M | 11.33M |
| Cost & Expenses | 37.96M | 46.11M | 51.03M | 39.60M | 56.02M | 35.56M | 36.76M | 34.78M | 27.96M |
| Interest Income | 0.00 | 0.00 | 0.00 | 0.00 | 0.00 | 0.00 | 0.00 | 0.00 | 0.00 |
| Interest Expense | 10.49M | 11.50M | 10.81M | 11.86M | 9.23M | 8.47M | 15.47M | 1.48M | 3.50M |
| Depreciation & Amortization | 717.00K | 702.00K | 1.08M | 911.00K | 913.00K | 454.00K | 401.00K | 276.00K | 270.00K |
| EBITDA | 6.58M | 13.53M | 9.71M | 15.65M | 12.20M | 14.05M | 20.10M | 27.03M | 555.00K |
| EBITDA Ratio | 19.80% | 27.70% | 17.18% | 23.87% | 16.05% | 20.84% | 27.84% | 61.62% | 1.97% |
| Operating Income | -4.71M | 2.73M | 5.48M | 25.96M | 20.01M | 31.87M | 35.41M | 9.09M | 285.00K |
| Operating Income Ratio | -14.15% | 5.59% | 9.69% | 39.59% | 26.32% | 47.27% | 49.07% | 20.71% | 1.01% |
| Total Other Income/Expenses | -15.48M | -14.79M | -26.75M | -6.69M | -8.99M | -9.22M | 36.52M | 29.09M | 24.28M |
| Income Before Tax | -20.18M | -12.06M | -21.27M | 19.27M | 11.02M | 22.65M | 71.93M | 38.17M | 24.57M |
| Income Before Tax Ratio | -60.70% | -24.69% | -37.64% | 29.38% | 14.49% | 33.59% | 99.66% | 87.02% | 86.98% |
| Income Tax Expense | -1.96M | 4.71M | 258.00K | 1.96M | 1.06M | 2.02M | 2.53M | 1.64M | 1.09M |
| Net Income | -2.66M | -3.38M | -2.43M | 927.00K | 997.00K | 3.11M | 1.70M | 23.64M | 23.48M |
| Net Income Ratio | -8.01% | -6.92% | -4.30% | 1.41% | 1.31% | 4.61% | 2.35% | 53.88% | 83.14% |
| EPS | -4.53 | -5.75 | -4.38 | 1.67 | 1.72 | 5.18 | 2.83 | 8.06 | 8.00 |
| EPS Diluted | -4.53 | -5.75 | -4.38 | 1.67 | 1.72 | 5.18 | 2.83 | 8.06 | 8.00 |
| Weighted Avg Shares Out | 587.82K | 587.82K | 555.30K | 555.30K | 580.40K | 600.24K | 600.00K | 2.93M | 2.93M |
| Weighted Avg Shares Out (Dil) | 587.82K | 587.82K | 555.30K | 555.30K | 580.40K | 600.24K | 600.00K | 2.93M | 2.93M |

1.2 million Singaporean households to get $340m in utilities support

Expect another 15% upside in ICICI Bank: MOFS

COMMENT: Finding a third Musketeer to run the National Bank of Ukraine

NBFCs' bad loans may worsen to 5-7% this fiscal due to weak economy: Icra

NBFCs' bad loans to rise to 5-7% in current fiscal: Icra

1.4m Singaporeans to get S$570m in GST vouchers in August

The Emerging Markets Internet & Ecommerce ETF (EMQQ) Announces Strong One-Year Performance and the Results of its Semi-Annual Rebalancing

No Slowdown for Mercer

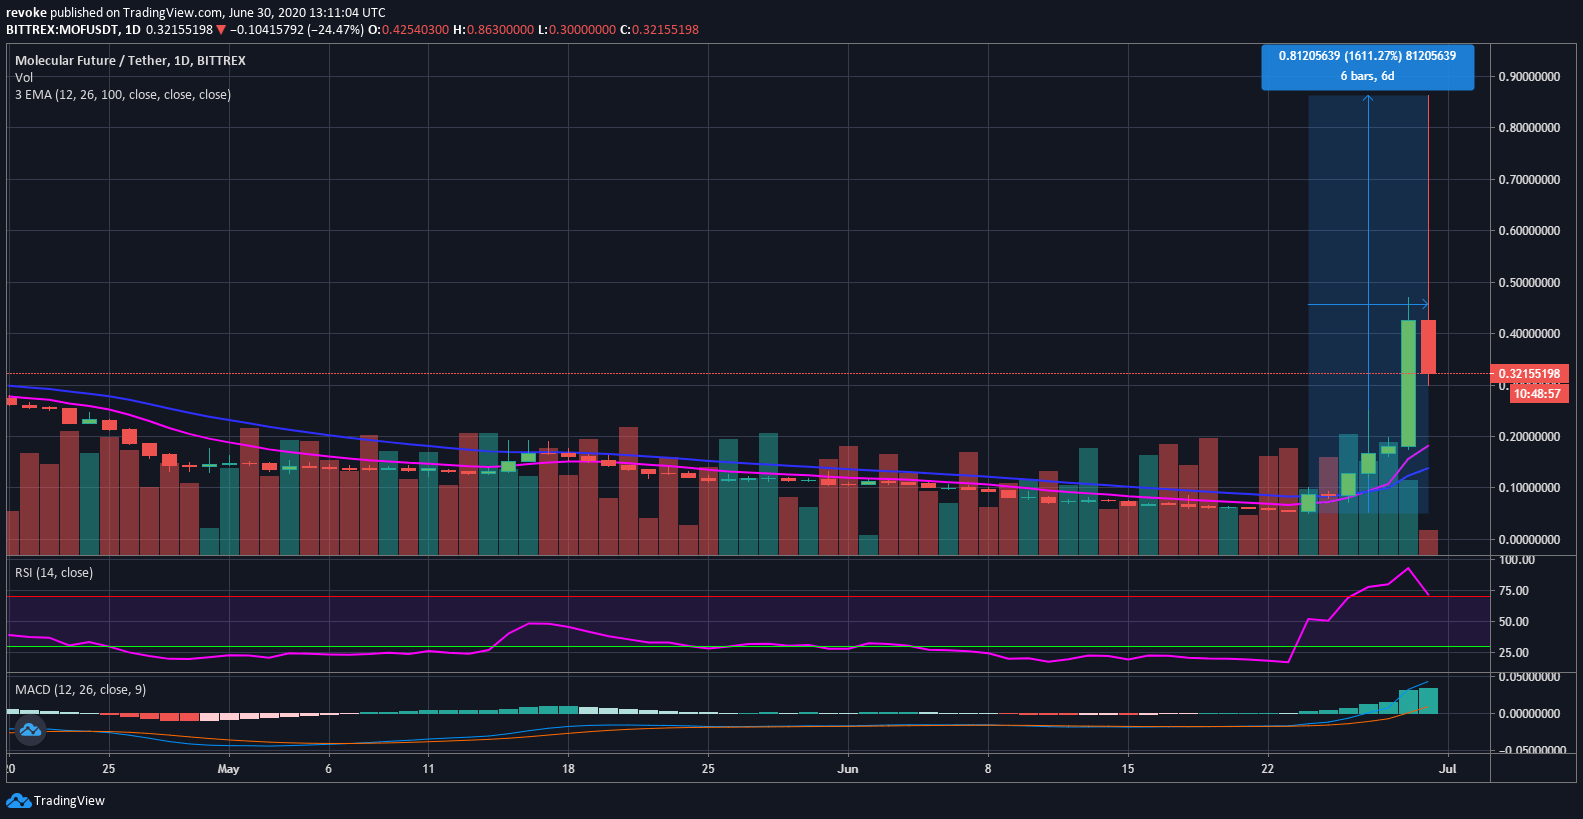
Molecular Future Technical Analysis: MOF/USD up 1600% in six days | Forex Crunch

Low pressure, precision porosity measurements in ultra-microporous range
Source: https://incomestatements.info
Category: Stock Reports
