See more : Altona Rare Earths Plc (REE.L) Income Statement Analysis – Financial Results
Complete financial analysis of Midwest Holding Inc. (MDWT) income statement, including revenue, profit margins, EPS and key performance metrics. Get detailed insights into the financial performance of Midwest Holding Inc., a leading company in the Insurance – Life industry within the Financial Services sector.
- iliad S.A. (ILD.PA) Income Statement Analysis – Financial Results
- MGI – Media and Games Invest SE (M8G.DE) Income Statement Analysis – Financial Results
- Skyworth Group Limited (0751.HK) Income Statement Analysis – Financial Results
- News Corporation (NWSA) Income Statement Analysis – Financial Results
- Core & Main, Inc. (CNM) Income Statement Analysis – Financial Results
Midwest Holding Inc. (MDWT)
About Midwest Holding Inc.
Midwest Holding Inc., a financial services company, engages in life and annuity insurance business in the United States. The company offers multi-year guaranteed and fixed indexed annuity products through independent distributors comprising independent marketing organizations. It also provides asset management services to third-party insurers and reinsurers; and other services, including policy administration services. The company was incorporated in 2003 and is based in Lincoln, Nebraska.
| Metric | 2022 | 2021 | 2020 | 2019 | 2018 | 2017 | 2016 | 2015 | 2014 | 2013 | 2012 | 2011 | 2010 |
|---|---|---|---|---|---|---|---|---|---|---|---|---|---|
| Revenue | 30.05M | 30.06M | 10.58M | 3.40M | 875.81K | 4.54M | 4.53M | 3.79M | 4.64M | 5.11M | 5.32M | 3.64M | 5.83M |
| Cost of Revenue | 16.20M | 32.03M | 16,547.38B | 8.70M | 5.80M | 0.00 | 0.00 | 0.00 | 0.00 | 0.00 | 0.00 | 0.00 | 0.00 |
| Gross Profit | 13.85M | -1.97M | -16,547.37B | -5.30M | -4.92M | 4.54M | 4.53M | 3.79M | 4.64M | 5.11M | 5.32M | 3.64M | 5.83M |
| Gross Profit Ratio | 46.10% | -6.54% | -156,374,437.67% | -155.88% | -562.08% | 100.00% | 100.00% | 100.00% | 100.00% | 100.00% | 100.00% | 100.00% | 100.00% |
| Research & Development | 0.00 | 0.00 | 0.00 | 0.00 | 0.00 | 0.00 | 0.00 | 0.00 | 0.00 | 0.00 | 0.00 | 0.00 | 0.00 |
| General & Administrative | 16.20M | 16.93M | 6.35M | 2.70M | 2.16M | 2.14M | 2.35M | 1.94M | 2.36M | 1.95M | 2.34M | 2.53M | 960.15K |
| Selling & Marketing | 0.00 | 0.00 | 0.00 | 0.00 | 0.00 | 0.00 | 0.00 | 0.00 | 0.00 | 0.00 | 0.00 | 0.00 | 0.00 |
| SG&A | 16.20M | 16.93M | 6.35M | 2.70M | 2.16M | 2.14M | 2.35M | 1.94M | 2.36M | 1.95M | 2.34M | 2.53M | 960.15K |
| Other Expenses | 5.53M | -63.09M | -29.81M | -14.53M | -8.05M | -8.65M | -12.05M | -9.15M | -10.90M | -9.27M | -10.19M | -9.95M | -9.02M |
| Operating Expenses | 7.66M | -46.17M | -23.46M | -11.83M | -5.89M | -6.51M | -9.71M | -7.21M | -8.55M | -7.32M | -7.84M | -7.42M | -8.06M |
| Cost & Expenses | 21.66M | 41.93M | 21.44M | 8.77M | 5.91M | 7.26M | 8.38M | 6.30M | 8.55M | 7.32M | 7.84M | 7.49M | 8.06M |
| Interest Income | 0.00 | 298.00K | 0.00 | 0.00 | 0.00 | 0.00 | 0.00 | 0.00 | 0.00 | 0.00 | 0.00 | 0.00 | 0.00 |
| Interest Expense | 6.35M | 0.00 | 0.00 | 6.58K | 47.94K | 748.92K | 776.54K | 533.65K | 0.00 | 0.00 | 0.00 | 0.00 | 0.00 |
| Depreciation & Amortization | 338.00K | 50.00K | 57.42K | 58.76K | 61.35K | 288.03K | 381.58K | 400.87K | 275.08K | 322.81K | 366.37K | 186.57K | 74.31K |
| EBITDA | 4.06M | 0.00 | 0.00 | -5.61M | -5.04M | -1.68M | -2.69M | -1.58M | 0.00 | 0.00 | 0.00 | 0.00 | 0.00 |
| EBITDA Ratio | 50.18% | -53.39% | -121.17% | -246.09% | -565.90% | -37.08% | -59.31% | -41.84% | -68.32% | -31.88% | -24.26% | -98.74% | -36.85% |
| Operating Income | 14.74M | -16.10M | -12.88M | -8.43M | -5.02M | -1.97M | -5.17M | -3.42M | -3.91M | -2.22M | -2.52M | -3.78M | -2.22M |
| Operating Income Ratio | 49.05% | -53.56% | -121.72% | -247.82% | -572.91% | -43.42% | -114.10% | -90.42% | -84.19% | -43.44% | -47.33% | -103.87% | -38.12% |
| Total Other Income/Expenses | -6.35M | 0.00 | 16,547.36B | 234.18K | 0.00 | 665.55K | -472.46K | 781.36K | 0.00 | 0.00 | 0.00 | -72.77K | 0.00 |
| Income Before Tax | 8.39M | -11.87M | -10.86M | -5.38M | -5.04M | -2.72M | -3.85M | -2.52M | -3.91M | -2.22M | -2.52M | -3.85M | -2.22M |
| Income Before Tax Ratio | 27.92% | -39.49% | -102.59% | -158.10% | -575.15% | -59.93% | -84.85% | -66.52% | -84.19% | -43.44% | -47.33% | -105.87% | -38.12% |
| Income Tax Expense | 7.60M | 4.77M | 1.58M | 234.18K | 47.94K | 1.32M | 883.56K | 705.22K | 295.25K | 246.33K | 381.69K | 223.71K | 3.75M |
| Net Income | 791.00K | -16.64M | -12.44M | -5.61M | -5.09M | -2.72M | -3.85M | -2.52M | -3.44M | -1.95M | -1.66M | -3.78M | -2.22M |
| Net Income Ratio | 2.63% | -55.34% | -117.56% | -164.99% | -580.63% | -59.93% | -84.85% | -66.52% | -74.25% | -38.21% | -31.14% | -103.87% | -38.12% |
| EPS | 0.21 | -4.45 | -4.81 | -4.87 | -2.55 | -59.48 | -88.97 | -89.41 | -130.56 | -74.01 | -91.02 | -206.56 | -163.97 |
| EPS Diluted | 0.21 | -4.45 | -4.81 | -4.87 | -2.55 | -59.48 | -88.97 | -89.41 | -130.56 | -73.92 | -91.02 | -206.56 | -163.97 |
| Weighted Avg Shares Out | 3.74M | 3.74M | 2.55M | 1.15M | 2.00M | 45.72K | 43.25K | 28.16K | 26.39K | 26.36K | 18.21K | 18.29K | 13.56K |
| Weighted Avg Shares Out (Dil) | 3.80M | 3.74M | 2.59M | 1.15M | 2.00M | 45.72K | 43.25K | 28.16K | 26.39K | 26.39K | 18.21K | 18.29K | 13.56K |

INVESTIGATION REMINDER: The Schall Law Firm Announces it is Investigating Claims Against Midwest Holding Inc. and Encourages Investors with Losses to Contact the Firm

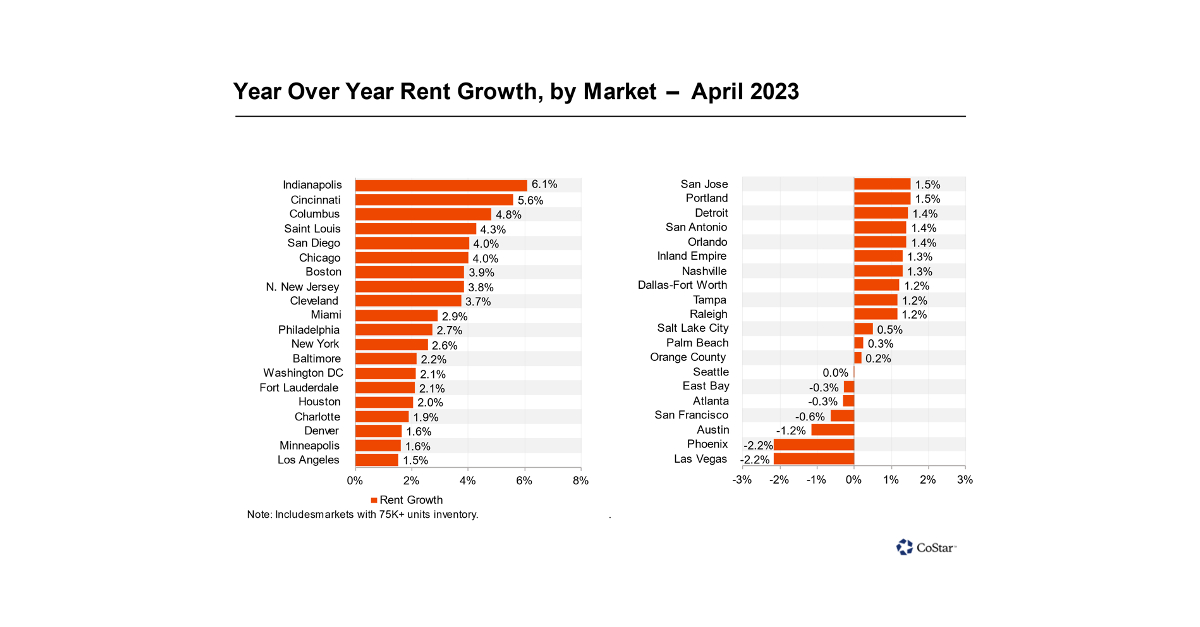
Apartments.com Publishes April 2023 Rent Growth Report

INVESTIGATION ALERT: The Schall Law Firm Announces it is Investigating Claims Against Midwest Holding Inc. and Encourages Investors with Losses to Contact the Firm

MIDWEST HOLDING INVESTOR ALERT by the Former Attorney General of Louisiana: Kahn Swick & Foti, LLC Investigates Adequacy of Price and Process in Proposed Sale of Midwest Holding Inc. - MDWT

MDWT Stock Alert: Halper Sadeh LLC Is Investigating Whether the Sale of Midwest Holding Inc. Is Fair to Shareholders

Schneider to provide Mexico to upper Midwest intermodal service on the newly formed CPKC

Midwest Holding Inc. (MDWT) Q4 2022 Earnings Call Transcript

Midwest Holding Schedules Conference Call to Review Results for Fourth Quarter and Full Year of 2022

Should Value Investors Buy Midwest Holding (MDWT) Stock?

2 Missed Growth Opportunities as the Fed Raises Rates by Half a Point
Source: https://incomestatements.info
Category: Stock Reports
