See more : Aveer Foods Limited (AVEER.BO) Income Statement Analysis – Financial Results
Complete financial analysis of MeaTech 3D Ltd. (MITC) income statement, including revenue, profit margins, EPS and key performance metrics. Get detailed insights into the financial performance of MeaTech 3D Ltd., a leading company in the Packaged Foods industry within the Consumer Defensive sector.
- Oxbridge Acquisition Corp. (OXACU) Income Statement Analysis – Financial Results
- Iron Force Industrial Co., Ltd. (2228.TW) Income Statement Analysis – Financial Results
- MEDIA DO Co., Ltd. (MDDCF) Income Statement Analysis – Financial Results
- VERBIO Vereinigte BioEnergie AG (0NLY.L) Income Statement Analysis – Financial Results
- Compagnie Financière Tradition SA (0QL7.L) Income Statement Analysis – Financial Results
MeaTech 3D Ltd. (MITC)
About MeaTech 3D Ltd.
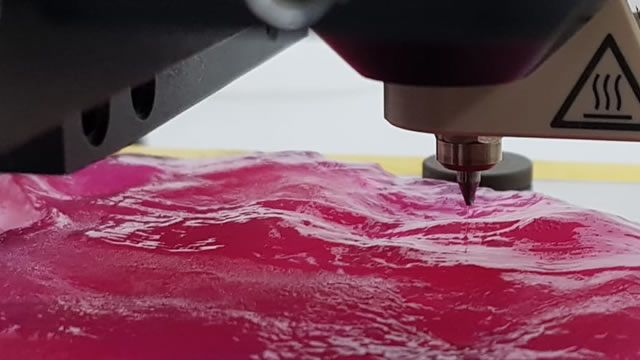
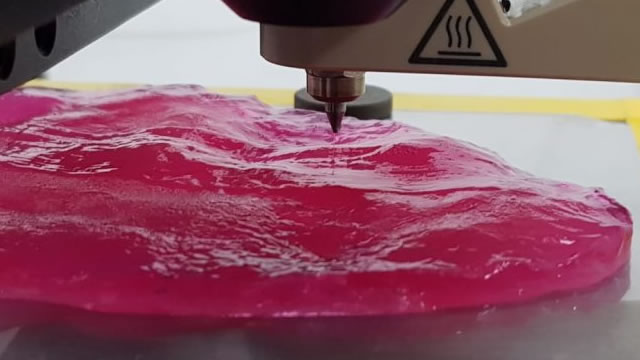
MeaTech 3D Ltd., a deep-tech food company, engages in the development of cultivated meat technologies to manufacture cultivated meat without animal slaughter. The company develops a three-dimensional bioprinter to deposit layers of differentiated stem cells, scaffolding, and cell nutrients in a three-dimensional form of structured cultured meat. It intends to license its production technology; provide associated products, such as cell lines, printheads, bioreactors, and incubators; and offer services, such as technology implementation, training, and engineering support directly and through contractors to food processing and food retail companies. The company is headquartered in Rehovot, Israel.
| Metric | 2023 | 2022 | 2021 | 2020 | 2019 | 2018 | 2017 | 2016 | 2015 | 2014 | 2013 | 2012 | 2011 | 2010 | 2009 | 2008 |
|---|---|---|---|---|---|---|---|---|---|---|---|---|---|---|---|---|
| Revenue | 0.00 | 0.00 | 0.00 | 0.00 | 0.00 | 49.12K | 410.29K | 318.46K | 314.32K | 0.00 | 0.00 | 245.72K | 395.69K | 356.26K | 97.15K | 0.00 |
| Cost of Revenue | 450.84K | 1.51M | 680.47K | 214.49K | 20.06K | 70.36K | 70.78K | 225.39K | 112.46K | 0.00 | 0.00 | 950.23K | 2.68M | 2.56M | 173.44K | 0.00 |
| Gross Profit | -450.84K | -1.51M | -680.47K | -214.49K | -20.06K | -21.24K | 339.51K | 93.07K | 201.86K | 0.00 | 0.00 | -704.51K | -2.29M | -2.20M | -76.29K | 0.00 |
| Gross Profit Ratio | 0.00% | 0.00% | 0.00% | 0.00% | 0.00% | -43.24% | 82.75% | 29.22% | 64.22% | 0.00% | 0.00% | -286.71% | -578.35% | -618.75% | -78.53% | 0.00% |
| Research & Development | 6.78M | 9.80M | 7.59M | 2.49M | 166.54K | 0.00 | 0.00 | 0.00 | 0.00 | 0.00 | 0.00 | 766.34K | 4.05M | 3.97M | 3.48M | 3.87M |
| General & Administrative | 3.77M | 7.30M | 8.66M | 15.53M | 816.10K | 665.13K | 741.45K | 361.36K | 286.14K | 115.56K | 474.66K | 1.99M | 3.35M | 3.20M | 1.47M | 804.79K |
| Selling & Marketing | 2.68M | 1.85M | 525.00K | 96.00K | 0.00 | 531.04 | 20.72K | 1.30K | 1.54K | 0.00 | 0.00 | 156.05K | 902.52K | 834.84K | 184.27K | 0.00 |
| SG&A | 6.91M | 9.15M | 9.19M | 15.63M | 816.10K | 665.66K | 762.17K | 362.66K | 287.68K | 115.56K | 474.66K | 2.15M | 4.25M | 4.04M | 1.65M | 804.79K |
| Other Expenses | 0.00 | 831.00K | 451.00K | 205.00K | 59.49K | 37.44K | -35.86K | -42.46K | -5.66K | 0.00 | 1.15K | 1.56M | 0.00 | 0.00 | 0.00 | 843.91K |
| Operating Expenses | 13.69M | 19.78M | 17.23M | 18.32M | 875.59K | 703.10K | 849.64K | 439.09K | 327.13K | 115.56K | 474.66K | 2.96M | 8.14M | 7.77M | 4.95M | 5.52M |
| Cost & Expenses | 14.14M | 19.78M | 17.23M | 18.32M | 875.59K | 773.46K | 920.42K | 664.48K | 439.59K | 115.56K | 474.66K | 3.91M | 10.83M | 10.33M | 5.12M | 5.52M |
| Interest Income | 1.37K | 85.00K | 20.00 | 8.00 | 4.33K | 0.00 | -1.15K | 59.41 | -11.27K | -513.62 | 574.30 | 16.33K | 1.84K | 80.89K | 64.15K | 273.55K |
| Interest Expense | 0.00 | 286.00K | 20.00K | 8.00K | 866.35 | 0.00 | 61.28K | 25.48K | 21.52K | 9.25K | 124.05K | 30.78K | 405.15K | 643.18K | 124.87K | 340.15K |
| Depreciation & Amortization | 450.84K | 382.50K | 680.47K | 214.49K | 20.06K | 12.24K | 27.25K | 15.89K | 7.69K | 0.00 | 2.87K | 249.47K | 312.66K | 186.58K | 103.48K | 207.47K |
| EBITDA | -13.69M | -25.72M | -17.33M | -26.92M | -403.30K | -549.34K | -901.71K | 617.65K | -452.74K | -115.56K | 1.48M | -2.10M | -12.34M | -9.21M | -4.92M | 365.02K |
| EBITDA Ratio | 0.00% | 0.00% | 0.00% | 0.00% | 0.00% | -2,888.12% | -250.35% | -77.06% | -55.58% | 0.00% | 0.00% | -854.47% | -2,075.70% | -2,072.86% | -5,130.71% | 0.00% |
| Operating Income | -14.14M | -35.36M | -17.23M | -18.54M | -2.33M | -1.43M | -1.06M | -261.27K | -182.39K | -115.56K | -41.06K | -3.52M | -12.40M | -9.97M | -5.02M | -5.52M |
| Operating Income Ratio | 0.00% | 0.00% | 0.00% | 0.00% | 0.00% | -2,911.90% | -257.22% | -82.04% | -58.03% | 0.00% | 0.00% | -1,433.77% | -3,133.00% | -2,799.13% | -5,170.93% | 0.00% |
| Total Other Income/Expenses | -1.37M | -13.67M | -4.60M | 17.00K | -2.37K | 132.73K | -481.07K | 1.10M | -394.76K | -9.25K | 1.50M | -269.81K | -1.11M | -2.35M | 169.36K | 2.10M |
| Income Before Tax | -15.51M | -30.77M | -18.02M | -18.52M | -3.36M | -1.46M | -991.20K | 754.69K | -520.02K | -124.81K | -67.19K | -3.79M | -14.30M | -12.37M | -4.96M | -3.42M |
| Income Before Tax Ratio | 0.00% | 0.00% | 0.00% | 0.00% | 0.00% | -2,966.49% | -241.59% | 236.98% | -165.44% | 0.00% | 0.00% | -1,543.57% | -3,614.67% | -3,473.02% | -5,104.63% | 0.00% |
| Income Tax Expense | 0.00 | 10.78M | 20.00K | 8.00K | -229.29K | 129.57K | 109.62K | 134.14K | 106.57K | -30.05K | 125.20K | 1.59M | 1.34M | 2.07M | -156.81K | -2.87M |
| Net Income | -16.86M | -41.55M | -18.04M | -18.53M | -3.13M | -1.59M | -1.10M | 620.55K | -626.59K | -124.81K | -67.19K | -3.79M | -11.77M | -12.04M | -4.87M | -2.65M |
| Net Income Ratio | 0.00% | 0.00% | 0.00% | 0.00% | 0.00% | -3,230.28% | -268.30% | 194.86% | -199.35% | 0.00% | 0.00% | -1,543.57% | -2,974.83% | -3,380.22% | -5,009.52% | 0.00% |
| EPS | -0.66 | -3.06 | -1.56 | -3.08 | -1.61 | -1.17 | -0.86 | 0.52 | -0.49 | -0.46 | -0.25 | -33.04 | -150.33 | -182.96 | -106.29 | -63.57 |
| EPS Diluted | -0.66 | -3.06 | -1.56 | -3.08 | -1.61 | -1.17 | -0.86 | 0.52 | -0.49 | -0.46 | -0.25 | -33.04 | -150.33 | -182.96 | -106.29 | -63.57 |
| Weighted Avg Shares Out | 23.66M | 13.59M | 11.60M | 6.01M | 1.95M | 1.36M | 1.28M | 1.18M | 1.29M | 272.21K | 271.44K | 114.80K | 78.30K | 65.82K | 45.79K | 41.74K |
| Weighted Avg Shares Out (Dil) | 23.66M | 13.59M | 11.60M | 6.01M | 1.95M | 1.36M | 1.28M | 1.18M | 1.29M | 272.21K | 271.44K | 114.80K | 78.30K | 65.82K | 45.79K | 41.74K |

MeaTech 3D Shares Slide On $6.5M Equity Offering

6 Stocks Halted In Wednesday's Session: Here's Why

CULT Food Science invests in leading cultivated meat company MeaTech 3D Ltd

MeaTech 3D (MITC) CEO, Arik Kaufman on Q4 2021 Results - Earnings Call Transcript

MITC Stock: The Lab-Grown Steak Breakthrough That Has MeaTech3D Looking Tasty Today

Meatech 3D Stock (MITC): Why The Price Increased Today

MeaTech Group To Hold Several Tasting Events at Key European Food Trade Shows

MITC Stock: Why It Increased Today

MeaTech Group Manufactures Over Half a Kilogram of Cultivated Fat Biomass in a Single Production Run

MeaTech 3D Ltd. (MITC) CEO Sharon Fima on Q2 2021 Results - Earnings Call Transcript
Source: https://incomestatements.info
Category: Stock Reports
