See more : Zuari Agro Chemicals Limited (ZUARI.NS) Income Statement Analysis – Financial Results
Complete financial analysis of Western Magnesium Corporation (MLYF) income statement, including revenue, profit margins, EPS and key performance metrics. Get detailed insights into the financial performance of Western Magnesium Corporation, a leading company in the Industrial Materials industry within the Basic Materials sector.
- EV Technology Group Ltd. (EVTG.NE) Income Statement Analysis – Financial Results
- Securitag Assembly Group Co., Ltd. (6417.TWO) Income Statement Analysis – Financial Results
- ResMed Inc. (RMD) Income Statement Analysis – Financial Results
- Sun Kong Holdings Limited (8631.HK) Income Statement Analysis – Financial Results
- Leet Technology Inc. (LTES) Income Statement Analysis – Financial Results
Western Magnesium Corporation (MLYF)
About Western Magnesium Corporation
Western Magnesium Corporation engages in the exploration and development of mineral properties in the United States. The company primarily explores for magnesium deposits. It holds a 100% interest in the Tami Mosi mining claim that consists of 81 unpatented mining claims covering an area of approximately 1,673 acres; four unpatented lode mining claims covering an area of approximately 10 acres located in the Moor Mining District in Elco County, Nevada; and the Silverado mining claim, which consists of three patented mining claims covering an area of approximately 296 acres located in the Pinto mining district of Nevada. The company was formerly known as Nevada Clean Magnesium Inc. and changed its name to Western Magnesium Corporation in May 2019. Western Magnesium Corporation was incorporated in 1966 and is headquartered in McLean, United States.
| Metric | 2021 | 2020 | 2019 | 2018 | 2017 | 2016 | 2015 | 2014 | 2013 | 2012 | 2011 | 2010 | 2009 | 2008 | 2007 | 2006 | 2005 | 2004 | 2003 | 2002 | 2001 |
|---|---|---|---|---|---|---|---|---|---|---|---|---|---|---|---|---|---|---|---|---|---|
| Revenue | 0.00 | 0.00 | 0.00 | 0.00 | 0.00 | 0.00 | 0.00 | 0.00 | 0.00 | 0.00 | 0.00 | 0.00 | 0.00 | 0.00 | 0.00 | 0.00 | 0.00 | 0.00 | 0.00 | 4.49 | 0.00 |
| Cost of Revenue | 229.90K | 87.58K | 7.80K | 1.98K | 331.28 | 0.00 | 0.00 | 0.00 | 0.00 | 0.00 | 0.00 | 0.00 | 0.00 | 0.00 | 0.00 | 0.00 | 0.00 | 0.00 | 0.00 | -2.51 | 0.00 |
| Gross Profit | -229.90K | -87.58K | -7.80K | -1.98K | -331.28 | 0.00 | 0.00 | 0.00 | 0.00 | 0.00 | 0.00 | 0.00 | 0.00 | 0.00 | 0.00 | 0.00 | 0.00 | 0.00 | 0.00 | 7.00 | 0.00 |
| Gross Profit Ratio | 0.00% | 0.00% | 0.00% | 0.00% | 0.00% | 0.00% | 0.00% | 0.00% | 0.00% | 0.00% | 0.00% | 0.00% | 0.00% | 0.00% | 0.00% | 0.00% | 0.00% | 0.00% | 0.00% | 155.87% | 0.00% |
| Research & Development | 0.00 | 758.23K | 0.00 | 0.00 | 0.00 | 0.00 | 0.00 | 0.00 | 0.00 | 0.00 | 0.00 | 0.00 | 0.00 | 0.00 | 0.00 | 0.00 | 0.00 | 0.00 | 0.00 | 0.00 | 0.00 |
| General & Administrative | 17.52M | 4.61M | 4.59M | 746.53K | 711.01K | 469.07K | 665.26K | 1.38M | 448.69K | 478.77K | 581.18K | 706.84K | 777.68K | 978.88K | 0.00 | 0.00 | 0.00 | 0.00 | 0.00 | 0.00 | 0.00 |
| Selling & Marketing | 3.42M | 0.00 | 0.00 | 0.00 | 0.00 | 10.10K | 0.00 | 54.97K | 0.00 | 0.00 | 0.00 | 0.00 | 0.00 | 0.00 | 0.00 | 0.00 | 0.00 | 0.00 | 0.00 | 0.00 | 0.00 |
| SG&A | 20.94M | 4.61M | 4.59M | 746.53K | 711.01K | 479.17K | 665.26K | 1.43M | 448.69K | 478.77K | 581.18K | 706.84K | 777.68K | 978.88K | 1.38M | 687.30K | 550.25K | 125.90K | 185.78K | 76.77K | 107.11K |
| Other Expenses | 0.00 | 0.00 | 391.52K | 3.98K | 2.95K | 0.00 | 0.00 | 0.00 | 0.00 | 0.00 | 16.76K | 16.51K | 23.39K | 20.34K | 5.71K | 2.70K | 1.44K | 455.74 | 525.05 | 3.66K | 682.51 |
| Operating Expenses | 21.07M | 4.61M | 4.98M | 750.51K | 713.96K | 479.17K | 665.26K | 1.43M | 448.69K | 478.77K | 597.93K | 723.36K | 801.07K | 999.22K | 1.39M | 690.00K | 551.69K | 126.35K | 186.30K | 77.33K | 107.79K |
| Cost & Expenses | 21.07M | 4.70M | 4.99M | 752.49K | 714.29K | 479.17K | 665.26K | 1.43M | 448.69K | 478.77K | 597.93K | 723.36K | 801.07K | 999.22K | 1.39M | 690.00K | 551.69K | 126.35K | 186.30K | 77.33K | 107.79K |
| Interest Income | -15.29K | 0.00 | 0.00 | 0.00 | 0.00 | 0.00 | 0.00 | 0.00 | 0.00 | 264.05 | 91.54 | 732.74 | 13.98K | 24.21K | 0.00 | 7.34K | 56.00 | 60.00 | 0.00 | 7.00 | 132.00 |
| Interest Expense | 74.32K | 61.25K | 1.61K | 56.87K | 30.69K | 30.75K | 465.77 | 15.77K | 17.63K | 27.86K | 1.69K | 1.31K | 2.62K | 2.46K | 0.00 | 1.23K | 621.00 | 753.00 | 18.67K | 188.00 | 780.00 |
| Depreciation & Amortization | 229.90K | 86.71K | 10.27K | 1.98K | 331.28 | 150.77K | -289.70K | -524.16K | -885.38K | -502.04K | -4.15K | 1.17K | 11.61K | 12.63K | 5.71K | 2.70K | 1.44K | 455.74 | 525.05 | 556.22 | 682.51 |
| EBITDA | -23.25M | -4.58M | -5.77M | -858.06K | -806.73K | -359.06K | -993.33K | -1.45M | -371.52K | -1.01M | -603.77K | -1.21M | -778.77K | -969.28K | -1.37M | -679.25K | -553.79K | -125.73K | -181.25K | -76.77K | -147.72K |
| EBITDA Ratio | 0.00% | 0.00% | 0.00% | 0.00% | 0.00% | 0.00% | 0.00% | 0.00% | 0.00% | 0.00% | 0.00% | 0.00% | 0.00% | 0.00% | 0.00% | 0.00% | 0.00% | 0.00% | 0.00% | -1,290,857.28% | 0.00% |
| Operating Income | -21.07M | -4.76M | -5.01M | -752.49K | -714.29K | -509.82K | -703.63K | -1.44M | -466.32K | -506.63K | -599.62K | -724.67K | -801.07K | -999.22K | -1.39M | -690.00K | -551.69K | -126.35K | -186.30K | -96.13K | -148.77K |
| Operating Income Ratio | 0.00% | 0.00% | 0.00% | 0.00% | 0.00% | 0.00% | 0.00% | 0.00% | 0.00% | 0.00% | 0.00% | 0.00% | 0.00% | 0.00% | 0.00% | 0.00% | 0.00% | 0.00% | 0.00% | -2,140,471.66% | 0.00% |
| Total Other Income/Expenses | -2.48M | 90.96K | -1.59M | -437.84K | 23.19K | 120.02K | -290.17K | -539.92K | -903.01K | -529.90K | -5.84K | -491.00K | 8.07K | 14.85K | -1.14K | 1.37K | -3.68K | -15.60 | 0.00 | -15.14K | -40.98K |
| Income Before Tax | -23.55M | -4.72M | -5.01M | -907.27K | -691.10K | -389.81K | -993.80K | -1.98M | -1.37M | -1.04M | -605.46K | -1.22M | -793.00K | -984.37K | -1.39M | -688.63K | -555.37K | -126.37K | 0.00 | -111.27K | -189.76K |
| Income Before Tax Ratio | 0.00% | 0.00% | 0.00% | 0.00% | 0.00% | 0.00% | 0.00% | 0.00% | 0.00% | 0.00% | 0.00% | 0.00% | 0.00% | 0.00% | 0.00% | 0.00% | 0.00% | 0.00% | 0.00% | -2,477,671.70% | 0.00% |
| Income Tax Expense | 5.60M | 61.25K | 1.61K | -97.91K | 53.88K | 127.95K | 0.00 | 0.00 | 0.00 | 0.00 | -105.62K | -489.68K | 10.69K | -137.60K | -1.14K | 2.60K | -3.06K | 737.40 | 18.67K | 18.92K | -40.20K |
| Net Income | -23.55M | -4.78M | -5.01M | -907.27K | -691.10K | -389.81K | -993.80K | -1.98M | -1.37M | -1.04M | -499.84K | -1.21M | -793.00K | -846.77K | -1.38M | -683.18K | -555.85K | -126.94K | -200.45K | -92.59K | -149.18K |
| Net Income Ratio | 0.00% | 0.00% | 0.00% | 0.00% | 0.00% | 0.00% | 0.00% | 0.00% | 0.00% | 0.00% | 0.00% | 0.00% | 0.00% | 0.00% | 0.00% | 0.00% | 0.00% | 0.00% | 0.00% | -2,061,743.08% | 0.00% |
| EPS | -0.08 | -0.02 | -0.02 | -0.01 | 0.00 | 0.00 | -0.01 | -0.01 | -0.01 | -0.01 | 0.00 | -0.01 | -0.01 | -0.01 | -0.02 | -0.02 | -0.02 | -0.01 | -0.01 | -0.01 | -0.01 |
| EPS Diluted | -0.08 | -0.02 | -0.02 | -0.01 | 0.00 | 0.00 | -0.01 | -0.01 | -0.01 | -0.01 | 0.00 | -0.01 | -0.01 | -0.01 | -0.02 | -0.02 | -0.02 | -0.01 | -0.01 | -0.01 | -0.01 |
| Weighted Avg Shares Out | 356.66M | 312.45M | 241.05M | 182.17M | 166.06M | 152.14M | 147.20M | 139.82M | 120.61M | 111.34M | 105.44M | 81.65M | 70.96M | 61.94M | 61.19M | 41.77M | 32.08M | 25.30M | 19.39M | 17.58M | 16.55M |
| Weighted Avg Shares Out (Dil) | 356.66M | 312.45M | 241.05M | 182.17M | 166.06M | 152.14M | 147.20M | 139.82M | 120.61M | 111.34M | 105.44M | 81.65M | 70.96M | 61.94M | 65.46M | 41.77M | 32.08M | 25.30M | 19.39M | 17.58M | 16.55M |

Western Magnesium hails output from Ohio commercial pilot plant as 'overwhelming success'
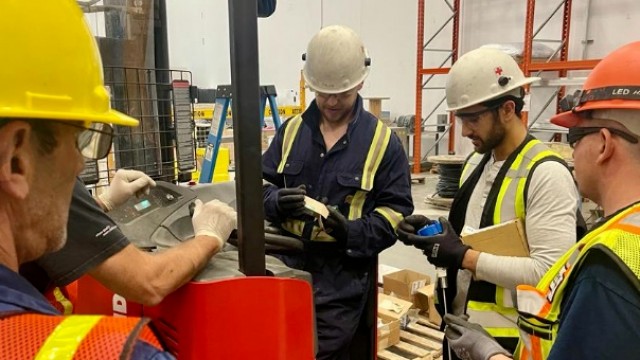
Western Magnesium takes aim at China's magnesium production share with 'cutting edge' pilot plant technology
Western Magnesium closes final tranche of non-brokered private placement for combined gross proceeds totaling US$616,750
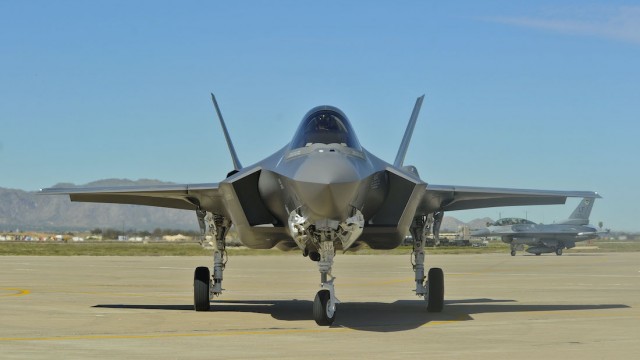
Western Magnesium poised to bring magnesium production back to the US amid global demand surge
Western Magnesium closes first tranche of previously announced non-brokered private placement for gross proceeds of U$431,750.00
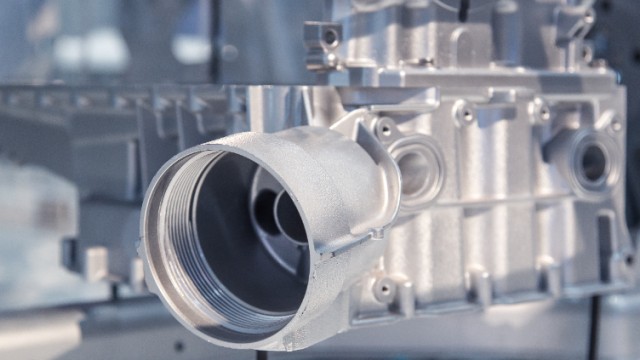
Western Magnesium applauds US national effort to secure critical minerals

Western Magnesium says it is "just weeks" away from magnesium production as its pilot plant receives inspection approval

Western Magnesium kicks off final engineering field inspections at its commercial pilot plant

Western Magnesium to raise up to US$3M for its green magnesium strategy
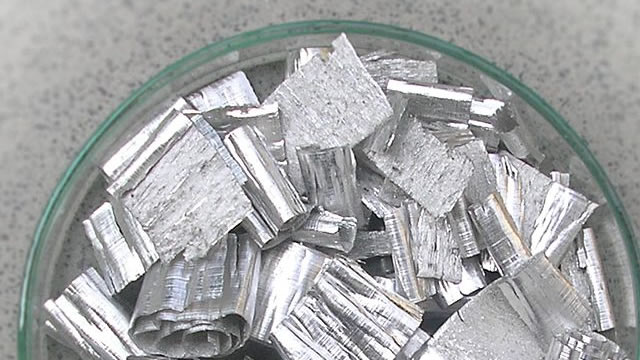
Western Magnesium hires independent valuation firm to assess company, its intellectual property (IP), systems and market potential
Source: https://incomestatements.info
Category: Stock Reports
