Complete financial analysis of Mitsubishi Motors Corporation (MMTOF) income statement, including revenue, profit margins, EPS and key performance metrics. Get detailed insights into the financial performance of Mitsubishi Motors Corporation, a leading company in the Auto – Manufacturers industry within the Consumer Cyclical sector.
- Ford Motor Company (FMC1.DE) Income Statement Analysis – Financial Results
- Jain Irrigation Systems Limited (JISLDVREQS.BO) Income Statement Analysis – Financial Results
- Xiana Mining Inc. (DRIFF) Income Statement Analysis – Financial Results
- ISPD Network, S.A. (ALISP.PA) Income Statement Analysis – Financial Results
- Chobi Company Limited (001550.KS) Income Statement Analysis – Financial Results
Mitsubishi Motors Corporation (MMTOF)
About Mitsubishi Motors Corporation
Mitsubishi Motors Corporation, together with its subsidiaries, develops, manufactures, and sells passenger vehicles in Japan, Europe, North America, Oceania, the rest of Asia, and internationally. Its products include EVs, PHEVs, SUVs and pickup trucks, MPVs, and cars under the Mitsubishi brand. The company is also involved in automobile transport and maintenance activities; auto sales financing, leasing, rental, and sale; investigation, testing, and research related to automobiles; and manufacturing of automobile engines and transmissions, and press parts. Mitsubishi Motors Corporation was incorporated in 1970 and is headquartered in Tokyo, Japan.
| Metric | 2024 | 2023 | 2022 | 2021 | 2020 | 2019 | 2018 | 2017 | 2016 | 2015 | 2014 | 2013 |
|---|---|---|---|---|---|---|---|---|---|---|---|---|
| Revenue | 2,789.59B | 2,458.14B | 2,038.91B | 1,455.48B | 2,270.28B | 2,514.59B | 2,192.39B | 1,906.63B | 2,267.85B | 2,180.73B | 2,093.41B | 1,815.11B |
| Cost of Revenue | 2,220.74B | 1,903.65B | 1,655.97B | 1,268.54B | 1,894.22B | 2,012.91B | 1,696.36B | 1,591.59B | 1,807.15B | 1,707.09B | 1,643.18B | 1,475.14B |
| Gross Profit | 568.85B | 554.50B | 382.94B | 186.93B | 376.06B | 501.69B | 496.03B | 315.04B | 460.70B | 473.64B | 450.23B | 339.97B |
| Gross Profit Ratio | 20.39% | 22.56% | 18.78% | 12.84% | 16.56% | 19.95% | 22.62% | 16.52% | 20.31% | 21.72% | 21.51% | 18.73% |
| Research & Development | 114.58B | 107.24B | 90.71B | 101.37B | 130.88B | 124.32B | 102.49B | 57.68B | 45.01B | 45.06B | 36.71B | 34.82B |
| General & Administrative | 146.94B | 72.75B | 49.85B | 29.11B | 51.06B | 138.69B | 142.97B | 123.41B | 130.14B | 122.81B | 118.22B | 60.76B |
| Selling & Marketing | 156.60B | 51.54B | 39.15B | 34.89B | 48.41B | 126.87B | 152.36B | 128.83B | 147.17B | 160.72B | 162.74B | 118.48B |
| SG&A | 303.54B | 256.76B | 204.90B | 180.89B | 232.40B | 265.56B | 295.34B | 252.24B | 277.31B | 283.54B | 280.95B | 228.98B |
| Other Expenses | -40.25B | -1.41B | 1.51B | 2.58B | -1.46B | 0.00 | 0.00 | 0.00 | 0.00 | 0.00 | 0.00 | 0.00 |
| Operating Expenses | 377.88B | 364.00B | 295.61B | 282.25B | 363.27B | 389.87B | 397.83B | 309.92B | 322.33B | 347.08B | 330.05B | 264.84B |
| Cost & Expenses | 2,598.62B | 2,267.65B | 1,951.58B | 1,550.80B | 2,257.49B | 2,402.78B | 2,094.19B | 1,901.51B | 2,129.47B | 2,054.17B | 1,973.23B | 1,739.99B |
| Interest Income | 13.41B | 7.62B | 1.94B | 1.85B | 5.35B | 5.05B | 3.46B | 3.53B | 4.97B | 2.94B | 2.99B | 5.73B |
| Interest Expense | 6.75B | 4.27B | 6.56B | 5.38B | 3.89B | 3.71B | 3.50B | 1.21B | 1.59B | 4.31B | 9.35B | 10.62B |
| Depreciation & Amortization | 67.74B | 60.13B | 53.63B | 65.92B | 74.79B | 62.18B | 52.55B | 46.82B | 58.72B | 62.45B | 59.21B | 54.33B |
| EBITDA | 254.62B | 250.63B | 140.96B | -29.40B | 87.58B | 173.99B | 150.75B | -110.72B | 197.10B | 198.36B | 182.65B | 121.71B |
| EBITDA Ratio | 9.13% | 10.20% | 6.91% | -2.02% | 3.86% | 6.92% | 6.88% | 2.72% | 8.69% | 9.10% | 8.72% | 6.71% |
| Operating Income | 190.97B | 190.50B | 87.33B | -95.32B | 12.79B | 111.82B | 98.20B | 5.12B | 138.38B | 135.91B | 123.44B | 67.38B |
| Operating Income Ratio | 6.85% | 7.75% | 4.28% | -6.55% | 0.56% | 4.45% | 4.48% | 0.27% | 6.10% | 6.23% | 5.90% | 3.71% |
| Total Other Income/Expenses | -10.14B | -22.37B | 7.36B | -202.97B | -8.99B | 6.54B | 4.85B | -163.86B | -29.55B | -6.41B | -6.24B | 2.01B |
| Income Before Tax | 180.83B | 168.13B | 94.69B | -298.29B | 3.80B | 118.35B | 103.05B | -158.74B | 108.83B | 129.50B | 117.19B | 69.39B |
| Income Before Tax Ratio | 6.48% | 6.84% | 4.64% | -20.49% | 0.17% | 4.71% | 4.70% | -8.33% | 4.80% | 5.94% | 5.60% | 3.82% |
| Income Tax Expense | 20.27B | -8.23B | 15.54B | 11.14B | 25.86B | -16.64B | -3.20B | 38.05B | 31.02B | 9.48B | 10.06B | 27.77B |
| Net Income | 154.71B | 168.73B | 74.04B | -312.32B | -25.78B | 132.87B | 107.62B | -198.52B | 72.58B | 118.17B | 104.66B | 37.98B |
| Net Income Ratio | 5.55% | 6.86% | 3.63% | -21.46% | -1.14% | 5.28% | 4.91% | -10.41% | 3.20% | 5.42% | 5.00% | 2.09% |
| EPS | 103.96 | 113.38 | 49.76 | -209.88 | -17.32 | 89.26 | 72.22 | -164.11 | 73.80 | 120.16 | 104.29 | 37.10 |
| EPS Diluted | 103.96 | 113.36 | 49.74 | -209.88 | -17.32 | 89.18 | 72.20 | -164.11 | 73.80 | 120.16 | 104.29 | 37.09 |
| Weighted Avg Shares Out | 1.49B | 1.49B | 1.49B | 1.49B | 1.49B | 1.49B | 1.49B | 1.21B | 983.44M | 983.44M | 1.00B | 1.02B |
| Weighted Avg Shares Out (Dil) | 1.49B | 1.49B | 1.49B | 1.49B | 1.49B | 1.49B | 1.49B | 1.21B | 983.44M | 983.44M | 1.00B | 1.02B |

These 6 Japanese Companies Could Buy Their Own Stock. Investors Should, Too.
Mitsubishi Launches Digital Retail Program as Auto Manufacturers Tap Omnichannel Tech

Mitsubishi Motors Corporation (MMTOF) Q2 2023 Earnings Call Transcript
Jury orders Mitsubishi to pay $977 mln over crash involving defective seatbelt
Mitsubishi Motors to invest around 20 bln yen into Renault's new EV company - Nikkei
Mitsubishi Motors to exit from China production - Nikkei

Indonesia says Mitsubishi Motors plans to invest $375 mln in 2024

Mitsubishi Motors Corporation (MMTOF) Q1 2023 Earnings Call Transcript

Mitsubishi Motors to extend suspension of production in China -Yomiuri
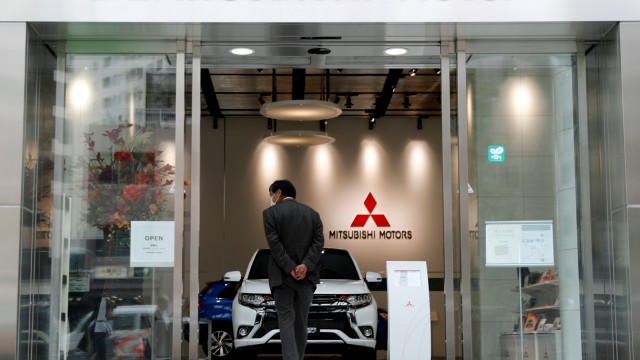
Mitsubishi Motors to electrify 100% of its fleet by 2035 - Yomiuri
Source: https://incomestatements.info
Category: Stock Reports
