See more : Lithium Americas Corp. (LAC.TO) Income Statement Analysis – Financial Results
Complete financial analysis of Everspin Technologies, Inc. (MRAM) income statement, including revenue, profit margins, EPS and key performance metrics. Get detailed insights into the financial performance of Everspin Technologies, Inc., a leading company in the Semiconductors industry within the Technology sector.
- ELL Environmental Holdings Limited (1395.HK) Income Statement Analysis – Financial Results
- NFT Technologies Inc. (NFT.NE) Income Statement Analysis – Financial Results
- Compass Diversified (CODI-PC) Income Statement Analysis – Financial Results
- Wizz Air Holdings Plc (WZZAF) Income Statement Analysis – Financial Results
- KWS SAAT SE & Co. KGaA (KWS.DE) Income Statement Analysis – Financial Results
Everspin Technologies, Inc. (MRAM)
About Everspin Technologies, Inc.
Everspin Technologies, Inc. manufactures and sells magnetoresistive random access memory (MRAM) products in the United States, Hong Kong, Japan, China, Canada, and internationally. It offers Toggle MRAM, spin-transfer torque MRAM, and tunnel magneto resistance sensor products, as well as foundry services for embedded MRAM. The company provides its products for applications, including data center, industrial, medical, automotive/transportation, and aerospace markets. It serves original equipment manufacturers and original design manufacturers through a direct sales channel and a network of representatives and distributors. Everspin Technologies, Inc. was incorporated in 2008 and is headquartered in Chandler, Arizona.
| Metric | 2023 | 2022 | 2021 | 2020 | 2019 | 2018 | 2017 | 2016 | 2015 | 2014 |
|---|---|---|---|---|---|---|---|---|---|---|
| Revenue | 63.77M | 59.99M | 55.15M | 42.03M | 37.50M | 49.42M | 35.94M | 27.09M | 26.55M | 24.90M |
| Cost of Revenue | 26.52M | 26.04M | 22.07M | 23.94M | 19.17M | 24.08M | 14.45M | 12.05M | 12.57M | 11.81M |
| Gross Profit | 37.25M | 33.95M | 33.07M | 18.09M | 18.33M | 25.33M | 21.49M | 15.05M | 13.98M | 13.09M |
| Gross Profit Ratio | 58.41% | 56.59% | 59.97% | 43.04% | 48.88% | 51.27% | 59.79% | 55.53% | 52.66% | 52.58% |
| Research & Development | 11.78M | 11.11M | 12.63M | 10.90M | 14.18M | 23.64M | 25.44M | 19.23M | 21.13M | 12.66M |
| General & Administrative | 14.30M | 11.74M | 10.95M | 10.77M | 12.41M | 12.55M | 11.52M | 7.28M | 6.57M | 7.09M |
| Selling & Marketing | 5.29M | 4.87M | 4.46M | 3.98M | 5.36M | 6.47M | 4.74M | 3.71M | 3.82M | 3.26M |
| SG&A | 19.58M | 16.61M | 15.41M | 14.76M | 17.78M | 19.02M | 16.26M | 10.99M | 10.39M | 10.34M |
| Other Expenses | 0.00 | 190.00K | -141.00K | -24.00K | 490.00K | 457.00K | 118.00K | 820.00K | 6.00K | -2.00K |
| Operating Expenses | 31.36M | 27.72M | 28.04M | 25.65M | 31.96M | 42.66M | 41.69M | 30.22M | 31.51M | 23.01M |
| Cost & Expenses | 57.88M | 53.76M | 50.11M | 49.59M | 51.13M | 66.74M | 56.14M | 42.27M | 44.08M | 34.81M |
| Interest Income | 0.00 | 274.00K | 547.00K | 665.00K | 747.00K | 0.00 | 0.00 | 0.00 | 0.00 | 0.00 |
| Interest Expense | 63.00K | 274.00K | 547.00K | 665.00K | 747.00K | 890.00K | 764.00K | 2.35M | 653.00K | 263.00K |
| Depreciation & Amortization | 1.21M | 982.00K | 1.46M | 1.98M | 1.69M | 1.45M | 1.19M | 826.00K | 1.34M | 1.52M |
| EBITDA | 7.09M | 7.40M | 6.35M | -5.61M | -12.23M | -15.41M | -19.15M | -13.54M | -16.19M | -8.40M |
| EBITDA Ratio | 11.12% | 12.33% | 11.51% | -13.28% | -30.52% | -31.19% | -52.59% | -49.93% | -60.99% | -33.75% |
| Operating Income | 5.89M | 6.23M | 5.04M | -7.56M | -13.63M | -17.32M | -20.21M | -15.17M | -17.54M | -9.92M |
| Operating Income Ratio | 9.23% | 10.38% | 9.13% | -17.99% | -36.34% | -35.05% | -56.23% | -56.01% | -66.06% | -39.84% |
| Total Other Income/Expenses | 3.15M | -84.00K | -688.00K | -689.00K | -257.00K | -433.00K | -892.00K | -1.19M | -647.00K | -265.00K |
| Income Before Tax | 9.04M | 6.14M | 4.35M | -8.25M | -14.67M | -17.75M | -21.10M | -16.70M | -18.18M | -10.18M |
| Income Before Tax Ratio | 14.17% | 10.24% | 7.88% | -19.63% | -39.11% | -35.93% | -58.72% | -61.64% | -68.50% | -40.90% |
| Income Tax Expense | -16.00K | 14.00K | 4.00K | 260.00K | 1.24M | 457.00K | 882.00K | 3.17M | 659.00K | 261.00K |
| Net Income | 9.05M | 6.13M | 4.34M | -8.51M | -15.91M | -17.75M | -21.10M | -16.70M | -18.18M | -10.18M |
| Net Income Ratio | 14.20% | 10.22% | 7.88% | -20.25% | -42.41% | -35.93% | -58.72% | -61.64% | -68.50% | -40.90% |
| EPS | 0.44 | 0.30 | 0.22 | -0.45 | -0.92 | -1.08 | -1.69 | -3.52 | -3.61 | -2.02 |
| EPS Diluted | 0.42 | 0.29 | 0.22 | -0.45 | -0.92 | -1.08 | -1.69 | -3.52 | -3.61 | -2.02 |
| Weighted Avg Shares Out | 20.75M | 20.13M | 19.40M | 18.78M | 17.32M | 16.37M | 12.48M | 4.74M | 5.04M | 5.04M |
| Weighted Avg Shares Out (Dil) | 21.37M | 20.78M | 19.97M | 18.78M | 17.32M | 16.37M | 12.48M | 4.74M | 5.04M | 5.04M |

Everspin Technologies' (MRAM) CEO Kevin Conley on Q3 2020 Results - Earnings Call Transcript

Everspin to Host Third Quarter 2020 Earnings Call on November 5

Everspin to Host Third Quarter 2020 Earnings Call on November 5

Get Exposure to a Wide Variety of Markets via SPI Energy

Despite Its Gains, SPI Energy Stock Remains a Risky Bet
Ideematec Unveils Horizon L:Tec Solar Tracker at Solar Power International 2020

SPI Energy News: Why SPI Stock Is Soaring 33% Today

Try SPI Energy Stock as an Unusual Entry Into the EV and CBD Markets

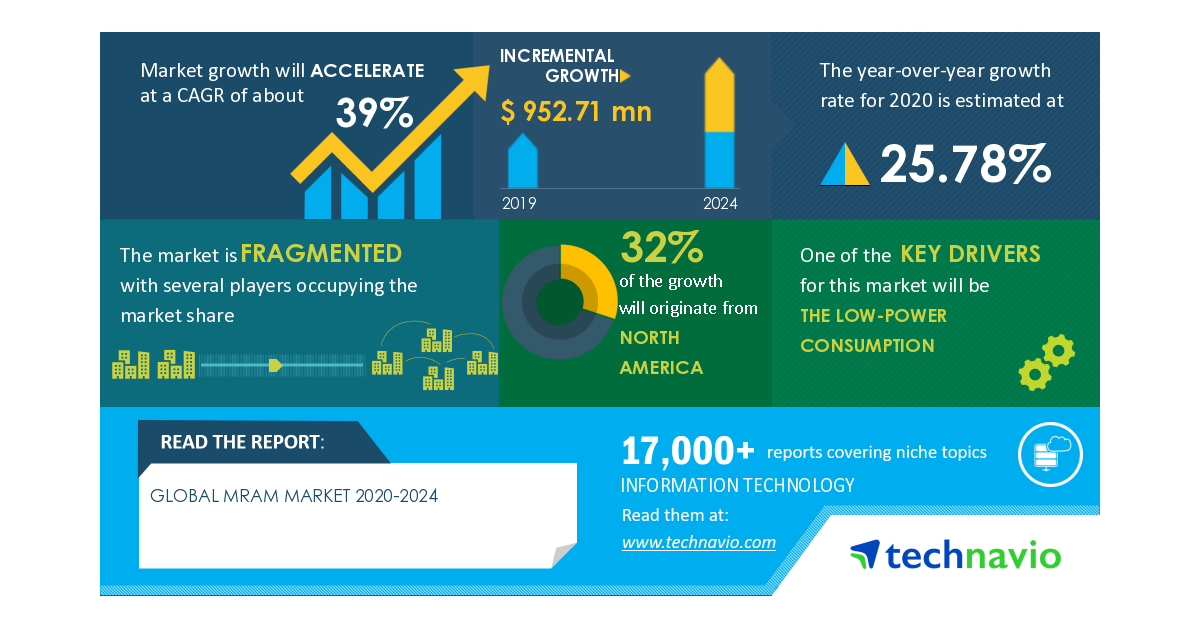
Global MRAM Market to Reach USD 952.71 Mn During 2020-2024, Avalanche Technology Inc. and CROCUS NANO ELECTRONICS LLC emerge as Key Contributors to growth | Technavio
Source: https://incomestatements.info
Category: Stock Reports

