See more : Altus Holdings Limited (8149.HK) Income Statement Analysis – Financial Results
Complete financial analysis of Murchison Minerals Ltd. (MURMF) income statement, including revenue, profit margins, EPS and key performance metrics. Get detailed insights into the financial performance of Murchison Minerals Ltd., a leading company in the Industrial Materials industry within the Basic Materials sector.
- Sinotrans Limited (601598.SS) Income Statement Analysis – Financial Results
- Tomra Systems ASA (TOM.OL) Income Statement Analysis – Financial Results
- Natur International Corp. (NTRU) Income Statement Analysis – Financial Results
- Albion Technology & General VCT PLC (AATG.L) Income Statement Analysis – Financial Results
- Ohmyhome Limited (OMH) Income Statement Analysis – Financial Results
Murchison Minerals Ltd. (MURMF)
About Murchison Minerals Ltd.
Murchison Minerals Ltd., together with its subsidiaries, engages in the acquisition, exploration, and evaluation of mineral properties in Canada. The company explores for zinc, nickel, copper, cobalt, and silver deposits. It owns a 100% interest in the Brabant-McKenzie deposit situated in north-central Saskatchewan; and the HPM project located in Québec. The company also holds an option to earn a 100% interest in the Barraute-Landrienne zinc-silver-gold project in Quebec. Murchison Minerals Ltd. is headquartered in Burlington, Canada.
| Metric | 2023 | 2022 | 2021 | 2020 | 2019 | 2018 | 2017 | 2016 | 2015 | 2014 | 2013 | 2012 | 2011 | 2010 | 2009 | 2008 | 2007 | 2006 | 2005 | 2004 | 2003 |
|---|---|---|---|---|---|---|---|---|---|---|---|---|---|---|---|---|---|---|---|---|---|
| Revenue | 0.00 | 0.00 | 0.00 | 0.00 | 0.00 | 0.00 | 0.00 | 0.00 | 0.00 | 0.00 | 0.00 | 0.00 | 10.32K | 11.71K | 27.35K | 82.43K | 0.00 | 0.00 | 0.00 | 0.00 | 0.00 |
| Cost of Revenue | 49.23K | 47.47K | 25.85K | 16.16K | 3.16K | 0.00 | 0.00 | 0.00 | 7.31K | 0.00 | 0.00 | 0.00 | 0.00 | 0.00 | 0.00 | 0.00 | 0.00 | 0.00 | 0.00 | 0.00 | 0.00 |
| Gross Profit | -49.23K | -47.47K | -25.85K | -16.16K | -3.16K | 0.00 | 0.00 | 0.00 | -7.31K | 0.00 | 0.00 | 0.00 | 10.32K | 11.71K | 27.35K | 82.43K | 0.00 | 0.00 | 0.00 | 0.00 | 0.00 |
| Gross Profit Ratio | 0.00% | 0.00% | 0.00% | 0.00% | 0.00% | 0.00% | 0.00% | 0.00% | 0.00% | 0.00% | 0.00% | 0.00% | 100.00% | 100.00% | 100.00% | 100.00% | 0.00% | 0.00% | 0.00% | 0.00% | 0.00% |
| Research & Development | 0.00 | 0.00 | 0.00 | 0.00 | 0.00 | 0.00 | 0.00 | 0.00 | 0.00 | 0.00 | 0.00 | 0.00 | 0.00 | 0.00 | 0.00 | 0.00 | 0.00 | 0.00 | 0.00 | 0.00 | 0.00 |
| General & Administrative | 610.12K | 1.30M | 1.07M | 758.52K | 751.45K | 1.16M | 436.18K | 533.79K | 318.48K | 874.14K | 270.87K | 395.18K | 591.94K | 820.05K | 776.59K | 998.26K | 0.00 | 0.00 | 0.00 | 0.00 | 0.00 |
| Selling & Marketing | 2.69M | 0.00 | 0.00 | 0.00 | 0.00 | 0.00 | 0.00 | 0.00 | 0.00 | 0.00 | 6.67K | 11.81K | 31.83K | 81.09K | 0.00 | 0.00 | 0.00 | 0.00 | 0.00 | 0.00 | 0.00 |
| SG&A | 2.39M | 1.30M | 1.07M | 758.52K | 751.45K | 1.16M | 436.18K | 533.79K | 318.48K | 874.14K | 277.54K | 406.99K | 623.77K | 901.14K | 776.59K | 998.26K | 1.23M | 987.42K | 1.14M | 355.52K | 35.94K |
| Other Expenses | 0.00 | 1.35M | 399.63K | 429.41K | 167.98K | 905.49K | 0.00 | 0.00 | 0.00 | 0.00 | 0.00 | 0.00 | 0.00 | 0.00 | 0.00 | 0.00 | 0.00 | 0.00 | 0.00 | 0.00 | 0.00 |
| Operating Expenses | 2.64M | 7.52M | 5.17M | 2.54M | 1.65M | 3.53M | 1.59M | 654.40K | 443.87K | 3.04M | 314.73K | 593.55K | 1.98M | 1.42M | 2.03M | 1.06M | 1.52M | 1.07M | 1.20M | 364.66K | 86.25K |
| Cost & Expenses | 2.64M | 7.52M | 5.17M | 2.54M | 1.65M | 3.53M | 1.59M | 654.40K | 443.87K | 3.04M | 314.73K | 593.55K | 1.98M | 1.42M | 2.03M | 1.06M | 1.52M | 1.07M | 1.20M | 364.66K | 86.25K |
| Interest Income | 47.54K | 62.00K | 4.96K | 3.35K | 7.73K | 25.07K | 10.60K | 6.07K | 364.00 | 11.31K | 175.00 | 3.57K | 10.32K | 11.71K | 27.35K | 82.43K | 167.68K | 98.25K | 136.68K | 84.00 | 5.78K |
| Interest Expense | 0.00 | 0.00 | 0.00 | 0.00 | 0.00 | 0.00 | 0.00 | 0.00 | 0.00 | 0.00 | 0.00 | 0.00 | 0.00 | 0.00 | 0.00 | 0.00 | 0.00 | 3.44K | 2.49K | 3.48K | 0.00 |
| Depreciation & Amortization | 49.23K | 47.47K | 25.85K | 16.16K | 3.16K | 3.04M | 165.00 | 165.00 | 7.31K | 65.90K | 2.22K | 7.62K | 9.72K | 10.01K | 13.82K | 6.64K | 2.13K | 1.99K | 602.00 | 447.00 | 262.00 |
| EBITDA | -2.23M | -7.47M | -5.14M | -2.53M | -1.64M | 448.55K | -1.47M | -655.49K | -5.17K | -2.94M | -187.07K | -372.95K | -1.79M | -1.40M | -1.99M | -3.68M | -1.52M | -1.07M | -1.20M | -364.22K | -85.99K |
| EBITDA Ratio | 0.00% | 0.00% | 0.00% | 0.00% | 0.00% | 0.00% | 0.00% | 0.00% | 0.00% | 0.00% | 0.00% | 0.00% | -17,365.19% | -10,821.37% | -7,073.74% | 101.24% | 0.00% | 0.00% | 0.00% | 0.00% | 0.00% |
| Operating Income | -2.28M | -7.52M | -5.17M | -2.54M | -1.65M | -3.53M | -1.59M | -654.40K | -928.06K | -3.75M | -436.47K | -818.84K | -2.13M | -1.53M | -1.95M | 76.82K | -1.52M | -1.07M | -1.20M | -364.66K | -86.25K |
| Operating Income Ratio | 0.00% | 0.00% | 0.00% | 0.00% | 0.00% | 0.00% | 0.00% | 0.00% | 0.00% | 0.00% | 0.00% | 0.00% | -20,619.66% | -13,095.63% | -7,124.25% | 93.19% | 0.00% | 0.00% | 0.00% | 0.00% | 0.00% |
| Total Other Income/Expenses | -306.14K | 862.40K | 215.94K | 296.52K | 175.88K | 943.79K | 412.64K | -47.61K | -2.61K | -576.90K | -3.52K | 15.89K | -10.61K | 0.00 | -109.05K | -231.21K | -5.70M | 306.00 | 134.19K | -5.85K | 5.78K |
| Income Before Tax | -2.59M | -6.10M | -4.76M | -2.11M | -1.47M | -2.59M | -1.18M | -645.07K | -874.90K | -3.64M | -439.99K | -802.96K | -2.14M | -1.53M | -2.06M | -2.04M | -7.22M | -1.07M | -1.06M | -370.51K | -80.47K |
| Income Before Tax Ratio | 0.00% | 0.00% | 0.00% | 0.00% | 0.00% | 0.00% | 0.00% | 0.00% | 0.00% | 0.00% | 0.00% | 0.00% | -20,722.47% | -13,095.63% | -7,522.94% | -2,475.32% | 0.00% | 0.00% | 0.00% | 0.00% | 0.00% |
| Income Tax Expense | 0.00 | -61.16K | -4.14K | -4.55K | -7.82K | -34.73K | -10.60K | -9.34K | 431.03K | -107.47K | 125.26K | -7.79K | 168.39K | 4.69K | 54.53K | -437.38K | -1.82M | -6.96K | -121.75K | 21.47K | -69.10K |
| Net Income | -2.59M | -6.10M | -4.76M | -2.11M | -1.47M | -2.59M | -1.18M | -645.07K | -874.90K | -3.53M | -439.99K | -795.17K | -2.14M | -1.54M | -2.06M | -1.60M | -5.41M | -1.06M | -940.14K | -391.98K | -11.37K |
| Net Income Ratio | 0.00% | 0.00% | 0.00% | 0.00% | 0.00% | 0.00% | 0.00% | 0.00% | 0.00% | 0.00% | 0.00% | 0.00% | -20,722.47% | -13,135.66% | -7,522.94% | -1,944.71% | 0.00% | 0.00% | 0.00% | 0.00% | 0.00% |
| EPS | -0.01 | -0.03 | -0.04 | -0.03 | -0.03 | -0.06 | -0.05 | -0.03 | -0.06 | -0.28 | -0.04 | -1.29 | -5.88 | -4.79 | -7.25 | -5.98 | -22.60 | -5.00 | -5.00 | -5.00 | -0.20 |
| EPS Diluted | -0.01 | -0.03 | -0.04 | -0.03 | -0.03 | -0.06 | -0.05 | -0.03 | -0.06 | -0.28 | -0.04 | -1.29 | -5.88 | -4.79 | -7.25 | -5.98 | -22.60 | -5.00 | -5.00 | -5.00 | -0.20 |
| Weighted Avg Shares Out | 228.29M | 192.18M | 115.85M | 71.32M | 47.44M | 42.56M | 25.94M | 19.28M | 15.55M | 12.66M | 9.91M | 617.24K | 363.73K | 321.10K | 283.72K | 268.09K | 239.25K | 212.71K | 188.03K | 78.40K | 56.84K |
| Weighted Avg Shares Out (Dil) | 228.28M | 192.18M | 115.85M | 71.32M | 47.44M | 42.56M | 25.94M | 19.28M | 15.55M | 12.66M | 9.91M | 617.24K | 363.73K | 321.10K | 283.72K | 268.09K | 239.25K | 212.71K | 188.03K | 78.40K | 56.84K |

Murchison Minerals stakes more claims at Brabant-McKenzie project thanks in part to new technical advisor
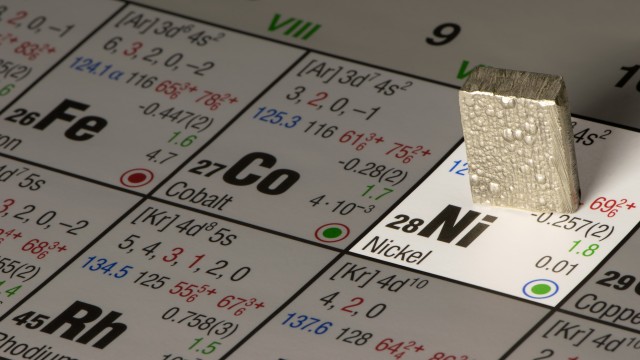
Nickel Miners News For The Month Of May 2023
Murchison Minerals sees high-grade nickel-bearing sulfide mineralization along 5 km trend; expands HPM project area

Nickel Miners News For The Month Of April 2023

Nickel Miners News For The Month Of March 2023

Murchison Minerals summer drilling program at HPM nickel project "bodes well", says broker

Murchison Minerals reports promising nickel-copper-cobalt drill results from Haut-Plateau de la Manicouagan project in Quebec.

Nickel Miners News For The Month Of January 2023
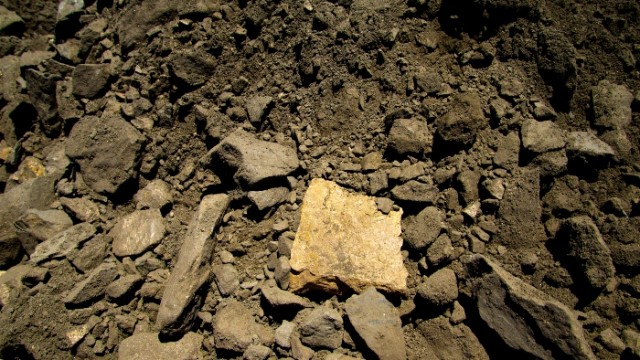
Murchison Minerals posts drill assays from BDF Zone at HPM project, showing it remains open, unconstrained, along strike and at depth
Murchison Minerals hits best intersection to date at its HPM project in Quebec; maiden resource slated for Q1, 2023
Source: https://incomestatements.info
Category: Stock Reports
