See more : York Exports Limited (YORKEXP.BO) Income Statement Analysis – Financial Results
Complete financial analysis of Newtek Business Services Corp. (NEWTL) income statement, including revenue, profit margins, EPS and key performance metrics. Get detailed insights into the financial performance of Newtek Business Services Corp., a leading company in the Asset Management industry within the Financial Services sector.
- PT Trimegah Bangun Persada Tbk (NCKL.JK) Income Statement Analysis – Financial Results
- Athena Constructions Limited (ATHCON.BO) Income Statement Analysis – Financial Results
- Beijing JIAYU Door, Window and Curtain Wall Joint-Stock Co., Ltd. (300117.SZ) Income Statement Analysis – Financial Results
- D.P. Wires Limited (DPWIRES.NS) Income Statement Analysis – Financial Results
- INTEGROUP INC (192A.T) Income Statement Analysis – Financial Results
Newtek Business Services Corp. (NEWTL)
About Newtek Business Services Corp.
NewtekOne, Inc. is a financial holding company, which engages in the provision of business and financial solutions. Its brands include Newtek Bank, Newtek Lending, Newtek Payments, Newtek Insurance, Newtek Payroll, and Newtek Technology. The company was founded by Barry Sloane in 1998 and is headquartered in Boca Raton, FL.
| Metric | 2023 | 2022 | 2021 | 2020 | 2019 | 2018 | 2017 | 2016 | 2015 | 2014 | 2013 | 2012 | 2011 | 2010 | 2009 | 2008 | 2007 | 2006 | 2005 | 2004 | 2003 | 2002 | 2001 | 2000 | 1999 |
|---|---|---|---|---|---|---|---|---|---|---|---|---|---|---|---|---|---|---|---|---|---|---|---|---|---|
| Revenue | 253.14M | 105.17M | 147.76M | 74.96M | 88.79M | 77.69M | 76.55M | 64.22M | 62.37M | 130.11M | 136.53M | 131.13M | 116.30M | 111.77M | 96.26M | 87.99M | 78.79M | 71.62M | 96.80M | 70.18M | 60.49M | 34.62M | 23.80M | 8.71M | 11.88M |
| Cost of Revenue | 44.30M | 20.19M | 29.81M | 18.69M | 14.31M | 21.08M | 19.29M | 15.23M | 12.75M | 66.96M | 100.12M | 94.50M | 69.15M | 68.19M | 58.31M | 51.11M | 0.00 | 0.00 | 0.00 | 0.00 | 0.00 | 0.00 | 0.00 | 0.00 | 0.00 |
| Gross Profit | 208.83M | 84.98M | 117.95M | 56.27M | 74.49M | 56.61M | 57.26M | 48.98M | 49.62M | 63.15M | 36.40M | 36.63M | 47.15M | 43.59M | 37.95M | 36.88M | 78.79M | 71.62M | 96.80M | 70.18M | 60.49M | 34.62M | 23.80M | 8.71M | 11.88M |
| Gross Profit Ratio | 82.50% | 80.81% | 79.83% | 75.07% | 83.89% | 72.86% | 74.80% | 76.28% | 79.55% | 48.54% | 26.66% | 27.94% | 40.55% | 38.99% | 39.42% | 41.91% | 100.00% | 100.00% | 100.00% | 100.00% | 100.00% | 100.00% | 100.00% | 100.00% | 100.00% |
| Research & Development | 0.00 | 0.25 | 0.52 | 0.32 | 0.37 | 0.38 | 0.50 | 0.44 | 0.00 | 0.00 | 0.00 | 0.00 | 0.00 | 0.00 | 0.00 | 0.00 | 0.00 | 0.00 | 0.00 | 0.00 | 0.00 | 0.00 | 0.00 | 0.00 | 0.00 |
| General & Administrative | 22.36M | 14.81M | 13.06M | 9.39M | 10.23M | 10.00M | 10.29M | 16.26M | 12.70M | 20.77M | 96.49M | 17.73M | 87.28M | 84.89M | 74.21M | 68.07M | 65.66M | 51.73M | 16.24M | 10.84M | 8.41M | 7.71M | 4.73M | 4.92M | 0.00 |
| Selling & Marketing | 0.00 | 0.00 | 0.00 | 0.00 | 0.00 | 0.00 | 0.00 | 0.00 | 0.00 | 24.83M | 0.00 | 0.00 | 0.00 | 0.00 | 0.00 | 0.00 | 0.00 | 0.00 | 0.00 | 0.00 | 0.00 | 0.00 | 0.00 | 0.00 | 0.00 |
| SG&A | 22.36M | 14.81M | 13.06M | 9.39M | 10.23M | 10.00M | 10.29M | 16.26M | 12.70M | 45.60M | 96.49M | 17.73M | 87.28M | 84.89M | 74.21M | 68.07M | 65.66M | 51.73M | 16.24M | 10.84M | 8.41M | 7.71M | 4.73M | 4.92M | 1.42M |
| Other Expenses | 0.00 | 51.59M | 49.23M | 32.95M | 34.26M | 30.94M | 25.11M | -725.00K | 382.00K | 0.00 | 28.97M | 26.16M | 26.75M | 26.01M | 26.06M | 32.99M | 30.66M | 23.54M | 49.87M | 29.11M | 20.14M | 5.62M | 2.71M | 0.00 | 0.00 |
| Operating Expenses | 101.14M | 66.40M | 62.29M | 42.34M | 44.49M | 40.94M | 35.40M | 31.79M | 25.78M | 47.25M | 125.46M | 21.58M | 114.03M | 110.90M | 100.26M | 101.06M | 96.31M | 75.27M | 66.11M | 39.95M | 28.54M | 13.33M | 7.43M | 4.92M | 1.42M |
| Cost & Expenses | 145.45M | 92.72M | 62.29M | 42.34M | 47.36M | 41.01M | 38.03M | 31.79M | 26.63M | 114.20M | 125.46M | 116.08M | 113.04M | 110.90M | 100.26M | 100.08M | 96.15M | 75.27M | 66.11M | 39.95M | 28.54M | 13.33M | 7.43M | 4.92M | 1.42M |
| Interest Income | 176.77M | 38.62M | 78.97M | 64.80M | 29.49M | 23.81M | 18.67M | 11.52M | 9.20M | 0.00 | 4.84M | 4.50M | 0.00 | 1.90M | 1.74M | 3.36M | 5.50M | 6.24M | 4.84M | 3.83M | 0.00 | 0.00 | 0.00 | 0.00 | 0.00 |
| Interest Expense | 67.74M | 26.33M | 20.52M | 17.88M | 20.42M | 16.07M | 11.40M | 8.44M | 6.48M | 0.00 | 5.86M | 4.50M | 3.42M | 4.48M | 10.35M | 10.89M | 14.04M | 16.28M | 16.03M | 14.04M | 13.88M | 0.00 | 0.00 | 7.28M | 0.00 |
| Depreciation & Amortization | 2.88M | 92.48M | 54.72M | 52.02M | 68.27M | 39.94M | 39.81M | 34.68M | 326.00K | 3.18M | 3.28M | 3.04M | 3.96M | 4.71M | 5.85M | 7.58M | 7.36M | 6.37M | 4.55M | 2.46M | 484.48K | 147.68K | 74.05K | 6.15K | 2.27K |
| EBITDA | 125.70M | 23.24M | 106.51M | 51.95M | 14.82M | 10.07M | 3.46M | -524.00K | 620.00K | 17.59M | 21.42M | 18.09M | 7.41M | 10.07M | 11.30M | 5.41M | 4.65M | 19.01M | 34.60M | 32.69M | 33.89M | 19.15M | 23.91M | 3.80M | 10.46M |
| EBITDA Ratio | 49.66% | 62.13% | 58.05% | 44.05% | 16.69% | 13.04% | 17.68% | 14.87% | 15.29% | 13.52% | 15.69% | 13.80% | 9.14% | 9.00% | 11.73% | 7.27% | 5.34% | 26.54% | 37.32% | 46.58% | 50.06% | 54.02% | 67.21% | 43.36% | 88.06% |
| Operating Income | 97.53M | 65.10M | 85.47M | 32.62M | 14.32M | 8.51M | 882.00K | -820.00K | -563.00K | 14.41M | 18.14M | 15.06M | 12.30M | 1.82M | 5.45M | -1.19M | -3.31M | 12.64M | 29.82M | 30.23M | 31.95M | 21.29M | 16.37M | 3.79M | 10.46M |
| Operating Income Ratio | 38.53% | 61.90% | 57.84% | 43.52% | 16.13% | 10.95% | 1.15% | -1.28% | -0.90% | 11.08% | 13.28% | 11.48% | 10.58% | 1.63% | 5.66% | -1.36% | -4.21% | 17.64% | 30.80% | 43.08% | 52.81% | 61.49% | 68.78% | 43.56% | 88.04% |
| Total Other Income/Expenses | -52.16M | -26.98M | -21.04M | -19.33M | 25.54M | 25.61M | 35.51M | -604.00K | 35.12M | -9.53M | -9.01M | -4.61M | -1.18M | -530.00K | -159.00K | -1.61M | -14.21M | -16.28M | -16.64M | -14.04M | -15.48M | -11.82M | -22.37M | -6.79M | -2.44M |
| Income Before Tax | 45.37M | 38.78M | 85.47M | 32.62M | 44.30M | 36.76M | 41.16M | 32.43M | 36.59M | 8.02M | 11.07M | 9.44M | 2.27M | 877.00K | -4.00M | -13.07M | -17.52M | -3.64M | 14.52M | 17.08M | 16.47M | 7.18M | 1.46M | -4.88M | 8.02M |
| Income Before Tax Ratio | 17.92% | 36.87% | 57.84% | 43.52% | 49.89% | 47.31% | 53.76% | 50.50% | 58.67% | 6.16% | 8.11% | 7.20% | 1.95% | 0.78% | -4.16% | -14.85% | -22.23% | -5.09% | 15.00% | 24.34% | 27.23% | 20.74% | 6.15% | -56.04% | 67.52% |
| Income Tax Expense | -1.96M | 6.46M | 1.33M | -999.00K | 3.16M | 1.08M | 2.18M | 5.13M | 857.00K | 4.13M | 3.92M | 3.88M | -1.10M | -418.00K | -2.59M | -2.05M | -6.38M | -581.00K | 6.79M | 6.47M | 7.09M | 2.66M | 534.62K | 1.14M | 2.60M |
| Net Income | 47.33M | 32.31M | 84.14M | 33.62M | 41.14M | 35.68M | 38.98M | 27.31M | 35.74M | 3.97M | 7.53M | 5.64M | 3.48M | 1.44M | -429.00K | -10.46M | -11.22M | -2.12M | 7.73M | 10.62M | 9.57M | 8.17M | 929.56K | -3.43M | 5.43M |
| Net Income Ratio | 18.70% | 30.72% | 56.94% | 44.85% | 46.33% | 45.92% | 50.91% | 42.52% | 57.30% | 3.05% | 5.51% | 4.30% | 2.99% | 1.29% | -0.45% | -11.89% | -14.24% | -2.96% | 7.98% | 15.13% | 15.82% | 23.59% | 3.91% | -39.32% | 45.66% |
| EPS | 1.89 | 1.34 | 3.69 | 1.59 | 2.13 | 1.91 | 2.25 | 1.88 | 3.32 | 0.37 | 1.07 | 0.79 | 0.49 | 0.20 | -0.06 | -1.46 | -1.57 | -0.30 | 1.13 | 1.77 | 1.86 | 1.69 | 0.21 | -0.89 | 1.49 |
| EPS Diluted | 1.88 | 1.34 | 3.69 | 1.59 | 2.13 | 1.91 | 2.25 | 1.88 | 3.32 | 0.37 | 0.99 | 0.77 | 0.48 | 0.20 | -0.06 | -1.46 | -1.57 | -0.30 | 1.13 | 1.75 | 1.83 | 1.68 | 0.21 | -0.89 | 1.49 |
| Weighted Avg Shares Out | 24.26M | 24.20M | 22.80M | 21.15M | 19.33M | 18.71M | 17.33M | 14.54M | 10.77M | 10.77M | 7.06M | 7.11M | 7.14M | 7.13M | 7.13M | 7.15M | 7.16M | 6.98M | 6.85M | 6.01M | 5.16M | 4.84M | 4.38M | 3.86M | 3.65M |
| Weighted Avg Shares Out (Dil) | 24.35M | 24.20M | 22.80M | 21.15M | 19.33M | 18.71M | 17.33M | 14.54M | 10.77M | 10.77M | 7.58M | 7.35M | 7.21M | 7.16M | 7.13M | 7.15M | 7.16M | 6.98M | 6.86M | 6.08M | 5.24M | 4.86M | 4.38M | 3.86M | 3.65M |

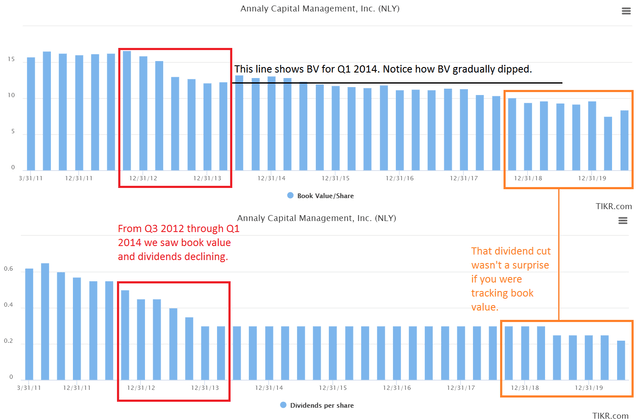
An Introduction To Annaly

Analysts Estimate Newtek (NEWT) to Report a Decline in Earnings: What to Look Out for

NEWTEK Business Services (NASDAQ:NEWT) Trading Up 1.9%

UBS Is Helping Small-Business Wealth Clients Get PPP Loans

Monroe Capital (MRCC) – Borrowers can’t default on loans if you lend them even more money
Newtek Small Business Finance Funds First Group of Paycheck Protection Program (PPP) Loans For Its Clients

NEWTEK Business Services (NASDAQ:NEWT) Stock Price Up 9.9%

Head to Head Contrast: NEWTEK Business Services (NASDAQ:NEWT) vs. Broadridge Financial Solutions (NASDAQ:BR)

NEWTEK Business Services (NASDAQ:NEWT) Trading Down 5.8%

Comparing NEWTEK Business Services (NASDAQ:NEWT) and International Monetary Systems (NASDAQ:ITNM)
Source: https://incomestatements.info
Category: Stock Reports
