See more : Gecina SA (GI6A.DU) Income Statement Analysis – Financial Results
Complete financial analysis of Nexa Resources S.A. (NEXA) income statement, including revenue, profit margins, EPS and key performance metrics. Get detailed insights into the financial performance of Nexa Resources S.A., a leading company in the Industrial Materials industry within the Basic Materials sector.
- PVA TePla AG (0NL1.L) Income Statement Analysis – Financial Results
- XinJiang Ba Yi Iron & Steel Co.,Ltd. (600581.SS) Income Statement Analysis – Financial Results
- Graubündner Kantonalbank (0QLT.L) Income Statement Analysis – Financial Results
- Sandu Pharmaceuticals Limited (SANDUPHQ.BO) Income Statement Analysis – Financial Results
- Australasian Metals Limited (A8G.AX) Income Statement Analysis – Financial Results
Nexa Resources S.A. (NEXA)
About Nexa Resources S.A.
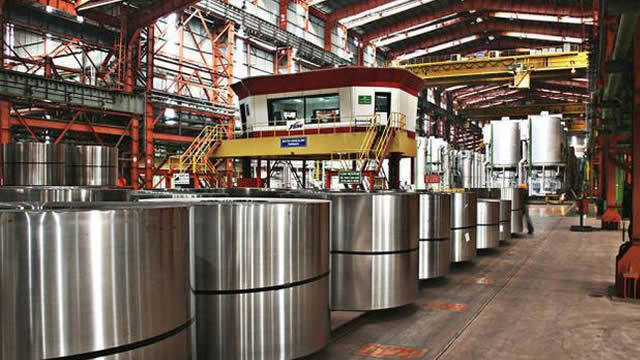
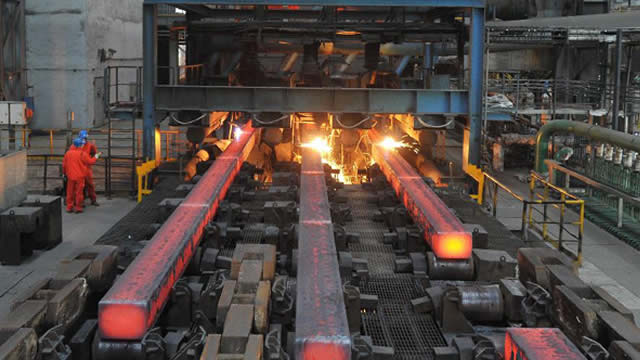
Nexa Resources S.A., together with its subsidiaries, engages in the zinc mining and smelting business. The company also produces zinc, silver, gold, copper cement, lead, sulfuric acid, sulfur dioxide, copper sulfate, and limestone deposits. It owns and operates five underground polymetallic mines, including three located in the Central Andes of Peru; and two located in the State of Minas Gerais in Brazil. The company also develops the Aripuanã project located in Mato Grosso, Brazil. It exports its products. The company was formerly known as VM Holding S.A. and changed its name to Nexa Resources S.A. in September 2017. The company was founded in 1956 and is based in Luxembourg, Luxembourg. Nexa Resources S.A. is a subsidiary of Votorantim S.A.
| Metric | 2023 | 2022 | 2021 | 2020 | 2019 | 2018 | 2017 | 2016 | 2015 | 2014 |
|---|---|---|---|---|---|---|---|---|---|---|
| Revenue | 2.57B | 3.03B | 2.62B | 1.95B | 2.33B | 2.49B | 2.45B | 1.91B | 1.87B | 2.12B |
| Cost of Revenue | 2.28B | 2.40B | 1.97B | 1.56B | 1.94B | 1.89B | 1.68B | 1.39B | 1.46B | 1.59B |
| Gross Profit | 296.48M | 638.81M | 656.07M | 387.00M | 387.62M | 602.26M | 768.28M | 525.74M | 401.89M | 523.44M |
| Gross Profit Ratio | 11.52% | 21.06% | 25.02% | 19.84% | 16.62% | 24.18% | 31.37% | 27.49% | 21.55% | 24.71% |
| Research & Development | 0.00 | 0.00 | 0.00 | 0.00 | 0.00 | 0.00 | 0.00 | 0.00 | 0.00 | 0.00 |
| General & Administrative | 124.15M | 141.48M | 129.54M | 0.00 | 0.00 | 140.86M | 148.24M | 127.31M | 106.30M | 149.81M |
| Selling & Marketing | 0.00 | 0.00 | 27.25M | 0.00 | 0.00 | 18.74M | 89.24M | 90.65M | 84.56M | 93.07M |
| SG&A | 124.15M | 141.48M | 156.79M | 151.62M | 216.51M | 159.60M | 237.48M | 217.95M | 190.86M | 242.88M |
| Other Expenses | 327.69M | 104.44M | 91.71M | 48.62M | 128.69M | -6.44M | -103.52M | -51.83M | -33.18M | -63.91M |
| Operating Expenses | 417.25M | 245.92M | 248.49M | 200.24M | 345.20M | 265.97M | 248.29M | 310.86M | 199.81M | 249.01M |
| Cost & Expenses | 2.73B | 2.64B | 2.21B | 1.76B | 2.29B | 2.15B | 1.93B | 1.70B | 1.66B | 1.84B |
| Interest Income | 11.62M | 17.89M | 7.45M | 8.15M | 5.50M | 26.03M | 3.63M | 10.09M | 7.09M | 3.41M |
| Interest Expense | 185.33M | 149.44M | 117.14M | 127.89M | 95.44M | 84.94M | 64.62M | 36.34M | 33.07M | 45.91M |
| Depreciation & Amortization | 298.39M | 292.45M | 265.38M | 240.81M | 315.42M | 267.75M | 281.52M | 352.61M | 295.26M | 319.03M |
| EBITDA | 190.25M | 686.64M | 716.94M | -290.57M | 216.93M | 514.01M | 649.61M | 612.04M | 173.94M | 510.57M |
| EBITDA Ratio | 7.39% | 21.37% | 24.76% | 19.81% | 14.43% | 24.26% | 26.70% | 21.79% | 23.88% | 24.10% |
| Operating Income | -155.37M | 359.22M | 446.19M | 142.49M | 18.77M | 334.55M | 401.58M | 129.97M | 163.93M | 172.28M |
| Operating Income Ratio | -6.04% | 11.84% | 17.02% | 7.30% | 0.80% | 13.43% | 16.39% | 6.79% | 8.79% | 8.13% |
| Total Other Income/Expenses | -138.11M | -131.84M | -136.90M | -819.15M | -234.65M | -202.65M | -125.97M | 64.43M | -354.21M | -200.21M |
| Income Before Tax | -293.47M | 227.38M | 309.29M | -676.66M | -215.88M | 131.90M | 271.46M | 208.89M | -178.26M | 5.21M |
| Income Before Tax Ratio | -11.40% | 7.49% | 11.80% | -34.68% | -9.26% | 5.29% | 11.08% | 10.92% | -9.56% | 0.25% |
| Income Tax Expense | -4.27M | 150.98M | 153.20M | -24.15M | -56.87M | 40.92M | 106.19M | 98.38M | -38.78M | 27.49M |
| Net Income | -289.35M | 76.39M | 156.09M | -652.51M | -159.01M | 74.86M | 126.89M | 93.17M | -129.46M | -33.84M |
| Net Income Ratio | -11.24% | 2.52% | 5.95% | -33.45% | -6.82% | 3.00% | 5.18% | 4.87% | -6.94% | -1.60% |
| EPS | -2.18 | 0.58 | 1.18 | -4.93 | -1.20 | 0.56 | 1.42 | 0.83 | -1.15 | -0.30 |
| EPS Diluted | -2.18 | 0.58 | 1.18 | -4.93 | -1.20 | 0.56 | 1.42 | 0.83 | -1.15 | -0.30 |
| Weighted Avg Shares Out | 132.44M | 132.44M | 132.44M | 132.44M | 132.62M | 133.31M | 116.53M | 112.82M | 112.82M | 112.82M |
| Weighted Avg Shares Out (Dil) | 132.44M | 132.44M | 132.44M | 132.44M | 132.62M | 133.31M | 116.53M | 112.82M | 112.82M | 112.82M |

NEXA vs. WPM: Which Stock Is the Better Value Option?

NEXA vs. WPM: Which Stock Should Value Investors Buy Now?

Nexa Resources S.A. (NEXA) Stock Jumps 6.2%: Will It Continue to Soar?

Should Value Investors Buy Nexa Resources (NEXA) Stock?

Is Nexa Resources (NEXA) a Suitable Value Investor Pick Now?

NEXA Resources Announces CFO Resignation

NEXA or WPM: Which Is the Better Value Stock Right Now?

NEXA vs. MP: Which Stock Is the Better Value Option?

What Makes Nexa Resources S.A. (NEXA) a New Strong Buy Stock

Are Investors Undervaluing Nexa Resources (NEXA) Right Now?
Source: https://incomestatements.info
Category: Stock Reports
