See more : Astor Explorations Corp. (ATOR) Income Statement Analysis – Financial Results
Complete financial analysis of Nikola Corporation (NKLA) income statement, including revenue, profit margins, EPS and key performance metrics. Get detailed insights into the financial performance of Nikola Corporation, a leading company in the Agricultural – Machinery industry within the Industrials sector.
- Qomolangma Acquisition Corp. (QOMOU) Income Statement Analysis – Financial Results
- RiverNorth Opportunistic Municipal Income Fund, Inc. (RMI) Income Statement Analysis – Financial Results
- Empire Metals Limited (EEE.L) Income Statement Analysis – Financial Results
- Beihai Gofar Chuanshan Biological Co., Ltd. (600538.SS) Income Statement Analysis – Financial Results
- CombiGene AB (publ) (COMBI.ST) Income Statement Analysis – Financial Results
Nikola Corporation (NKLA)
About Nikola Corporation
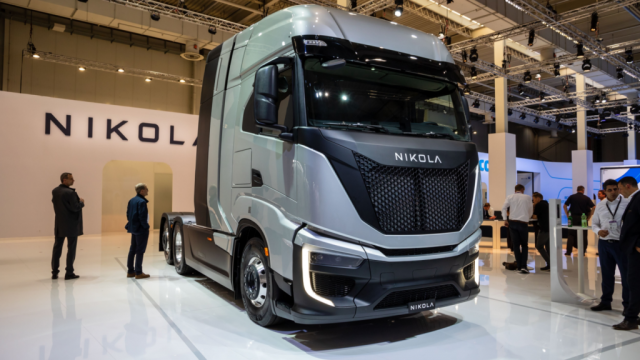
Nikola Corporation operates as a technology innovator and integrator that works to develop energy and transportation solutions. It operates through two business units, Truck and Energy. The Truck business unit develops and commercializes battery hydrogen-electric and battery-electric semi-trucks to the trucking sector. The Energy business unit develops and constructs a network of hydrogen fueling stations; and offers BEV charging solutions for its FCEV and BEV customers, as well as other third-party customers. The company also assembles, integrates, and commissions its vehicles in collaboration with its business partners and suppliers. Nikola Corporation is headquartered in Phoenix, Arizona.
| Metric | 2023 | 2022 | 2021 | 2020 | 2019 | 2018 | 2017 |
|---|---|---|---|---|---|---|---|
| Revenue | 35.84M | 50.83M | 95.00K | 95.00K | 482.00K | 173.00K | 486.00K |
| Cost of Revenue | 249.91M | 155.58M | 72.00K | 72.00K | 271.00K | 50.00K | 304.00K |
| Gross Profit | -214.07M | -104.76M | 23.00K | 23.00K | 211.00K | 123.00K | 182.00K |
| Gross Profit Ratio | -597.30% | -206.11% | 24.21% | 24.21% | 43.78% | 71.10% | 37.45% |
| Research & Development | 208.16M | 273.77M | 292.95M | 185.62M | 67.51M | 58.37M | 11.62M |
| General & Administrative | 196.77M | 368.15M | 398.68M | 182.02M | 910.21K | 402.30K | 0.00 |
| Selling & Marketing | 2.00M | 2.00M | 1.90M | 700.00K | 19.78M | 11.84M | 0.00 |
| SG&A | 198.77M | 370.15M | 400.58M | 182.72M | 20.69M | 12.24M | 5.85M |
| Other Expenses | 28.83M | -1.02M | 4.10M | -846.00K | 1.37M | 6.00K | 0.00 |
| Operating Expenses | 435.76M | 643.92M | 693.53M | 368.34M | 88.21M | 70.61M | 18.50M |
| Cost & Expenses | 685.67M | 799.50M | 693.53M | 368.42M | 88.48M | 70.66M | 18.80M |
| Interest Income | 0.00 | 17.74M | 481.00K | 202.00K | 1.46M | 686.00K | 814.00K |
| Interest Expense | 76.02M | 17.71M | 481.00K | 0.00 | 0.00 | 0.00 | 0.00 |
| Depreciation & Amortization | 35.89M | 22.77M | 8.23M | 6.01M | 2.32M | 625.00K | 412.00K |
| EBITDA | -736.28M | -676.99M | -685.30M | -362.31M | -85.67M | -69.86M | -16.87M |
| EBITDA Ratio | -2,054.40% | -1,434.83% | -717,045.26% | -364,813.68% | -17,081.54% | -42,408.09% | -3,471.19% |
| Operating Income | -649.83M | -748.68M | -693.53M | -368.32M | -88.00M | -70.49M | -17.28M |
| Operating Income Ratio | -1,813.19% | -1,473.05% | -730,027.37% | -387,705.26% | -18,256.22% | -40,745.09% | -3,555.97% |
| Total Other Income/Expenses | -198.36M | -35.50M | 6.67M | -3.57M | -510.00K | 4.19M | -1.85M |
| Income Before Tax | -848.19M | -763.57M | -686.85M | -384.70M | -88.51M | -66.30M | -19.13M |
| Income Before Tax Ratio | -2,366.67% | -1,502.35% | -723,004.21% | -404,950.53% | -18,362.03% | -38,320.81% | -3,936.21% |
| Income Tax Expense | 12.00K | 6.00K | 4.00K | -1.03M | 151.00K | -2.00M | 1.57M |
| Net Income | -966.28M | -763.57M | -686.86M | -383.68M | -88.66M | -64.29M | -17.56M |
| Net Income Ratio | -2,696.17% | -1,502.36% | -723,008.42% | -403,870.53% | -18,393.36% | -37,163.58% | -3,612.35% |
| EPS | -36.31 | -52.00 | -51.90 | -35.47 | -10.13 | -8.52 | -2.33 |
| EPS Diluted | -36.23 | -51.85 | -51.67 | -34.27 | -10.13 | -8.52 | -2.33 |
| Weighted Avg Shares Out | 26.61M | 14.68M | 13.23M | 10.82M | 8.75M | 7.55M | 7.55M |
| Weighted Avg Shares Out (Dil) | 26.67M | 14.73M | 13.29M | 11.19M | 8.75M | 7.55M | 7.55M |

Penny Stock Peril: 7 Cheap Stocks That Could Leave You Penniless

EV Market Mayhem: 3 Electric Vehicle Stocks to Dump Before They Short-Circuit

Cash Out Before They Crash Out: 7 Stocks About to Drop Quickly

The Penny Stock Minefield: 3 Stocks to Steer Clear Of at All Costs

Down -18.01% in 4 Weeks, Here's Why Nikola (NKLA) Looks Ripe for a Turnaround

3 Sorry Hydrogen Stocks to Sell in May While You Still Can

Monster insider trading alert for Nikola stock

Monster insider trading alert for Nikola stock

Why Is Nikola (NKLA) Stock Up 5% Today?

Nikola Stock Has Tumbled. The CEO Just Bought a Million Shares.
Source: https://incomestatements.info
Category: Stock Reports
