See more : Ind-Swift Limited (INDSWFTLTD.NS) Income Statement Analysis – Financial Results
Complete financial analysis of New Age Metals Inc. (NMTLF) income statement, including revenue, profit margins, EPS and key performance metrics. Get detailed insights into the financial performance of New Age Metals Inc., a leading company in the Industrial Materials industry within the Basic Materials sector.
- China Metal Products Co., Ltd. (1532.TW) Income Statement Analysis – Financial Results
- Rebus Holdings, Inc. (RBSH) Income Statement Analysis – Financial Results
- Zhangzhou Pientzehuang Pharmaceutical., Ltd (600436.SS) Income Statement Analysis – Financial Results
- Dalipal Holdings Limited (1921.HK) Income Statement Analysis – Financial Results
- Xeris Biopharma Holdings, Inc. (0A8E.L) Income Statement Analysis – Financial Results
New Age Metals Inc. (NMTLF)
About New Age Metals Inc.
New Age Metals Inc., a mineral exploration company, engages in the acquisition, exploration, and development of platinum group metals (PGMs), and precious and base metal properties in Canada. The company explores for rhodium, palladium, platinum, gold, nickel, copper, and lithium deposits. It holds interests in the River Valley PGE project located in the Dana and Pardo townships of Northern Ontario; the Genesis PGE project located in south central Alaska; and lithium projects, which consists of 67 claims covering an area of 11,620 hectares situated to the northeast of Winnipeg, Manitoba. The company was formerly known as Pacific North West Capital Corp. and changed its name to New Age Metals Inc. in February 2017. New Age Metals Inc. was incorporated in 1996 and is headquartered in Vancouver, Canada.
| Metric | 2024 | 2023 | 2022 | 2021 | 2020 | 2019 | 2018 | 2017 | 2016 | 2015 | 2014 | 2013 | 2012 | 2011 | 2010 | 2009 | 2008 | 2007 | 2006 | 2005 | 2004 | 2003 | 2002 |
|---|---|---|---|---|---|---|---|---|---|---|---|---|---|---|---|---|---|---|---|---|---|---|---|
| Revenue | 0.00 | 0.00 | 0.00 | 0.00 | 0.00 | 0.00 | 0.00 | 0.00 | 0.00 | 0.00 | 0.00 | 0.00 | 0.00 | 0.00 | 0.00 | 0.00 | 0.00 | 0.00 | 0.00 | 0.00 | 0.00 | 0.00 | 0.00 |
| Cost of Revenue | 52.01K | 57.88K | 38.61K | 46.56K | 32.74K | 5.12K | 1.28K | 1.60K | 2.00K | 0.00 | 0.00 | 0.00 | 0.00 | 0.00 | 0.00 | 0.00 | 0.00 | 0.00 | 0.00 | 0.00 | 0.00 | 0.00 | 0.00 |
| Gross Profit | -52.01K | -57.88K | -38.61K | -46.56K | -32.74K | -5.12K | -1.28K | -1.60K | -2.00K | 0.00 | 0.00 | 0.00 | 0.00 | 0.00 | 0.00 | 0.00 | 0.00 | 0.00 | 0.00 | 0.00 | 0.00 | 0.00 | 0.00 |
| Gross Profit Ratio | 0.00% | 0.00% | 0.00% | 0.00% | 0.00% | 0.00% | 0.00% | 0.00% | 0.00% | 0.00% | 0.00% | 0.00% | 0.00% | 0.00% | 0.00% | 0.00% | 0.00% | 0.00% | 0.00% | 0.00% | 0.00% | 0.00% | 0.00% |
| Research & Development | 0.00 | 0.00 | 0.00 | 0.00 | 0.00 | 0.00 | 0.00 | 0.00 | 0.00 | 0.00 | 2.55K | 50.05K | 49.38K | 71.90K | 0.00 | 0.00 | 0.00 | 0.00 | 0.00 | 0.00 | 0.00 | 0.00 | 0.00 |
| General & Administrative | 571.97K | 330.56K | 738.77K | 368.33K | 172.56K | 500.54K | 853.63K | 822.45K | 210.86K | 682.30K | 1.14M | 1.77M | 2.87M | 1.58M | 1.75M | 2.60M | 2.06M | 0.00 | 0.00 | 0.00 | 0.00 | 0.00 | 0.00 |
| Selling & Marketing | 99.30K | 148.42K | 334.33K | 259.36K | 170.10K | 444.35K | 722.79K | 209.07K | 16.78K | 67.79K | 0.00 | 0.00 | 0.00 | 0.00 | 0.00 | 0.00 | 0.00 | 0.00 | 0.00 | 0.00 | 0.00 | 0.00 | 0.00 |
| SG&A | 964.98K | 811.15K | 1.37M | 886.30K | 581.92K | 1.27M | 1.86M | 1.03M | 332.86K | 750.09K | 1.14M | 1.77M | 2.87M | 1.58M | 1.75M | 2.60M | 2.06M | 1.53M | 1.35M | 1.86M | 1.44M | 1.34M | 1.16M |
| Other Expenses | 0.00 | 128.09K | 317.38K | 86.98K | 24.60K | 121.55K | 95.36K | -531.77K | 0.00 | 0.00 | 0.00 | 0.00 | 0.00 | 0.00 | 0.00 | 0.00 | 0.00 | 0.00 | 0.00 | 0.00 | 0.00 | 0.00 | 0.00 |
| Operating Expenses | 964.98K | 811.15K | 1.37M | 886.30K | 581.92K | 1.27M | 1.86M | 1.03M | 332.86K | 781.27K | 1.18M | 1.88M | 2.97M | 1.69M | 1.79M | 2.65M | 2.09M | 1.55M | 996.77K | 1.56M | 1.32M | 1.04M | 593.54K |
| Cost & Expenses | 1.02M | 869.03K | 1.41M | 932.86K | 614.67K | 1.27M | 1.86M | 1.03M | 334.86K | 781.27K | 1.18M | 1.88M | 2.97M | 1.69M | 1.79M | 2.65M | 2.09M | 1.55M | 996.77K | 1.56M | 1.32M | 1.04M | 593.54K |
| Interest Income | 0.00 | 17.70K | 17.01K | 17.21K | 12.06K | 729.00 | 0.00 | 198.00 | 0.00 | 15.00 | 1.48K | 16.61K | 33.13K | 52.29K | 52.62K | 222.25K | 314.08K | 0.00 | 0.00 | 0.00 | 0.00 | 0.00 | 0.00 |
| Interest Expense | 13.17K | 15.61K | 3.53K | 6.63K | 8.53K | 3.63K | 11.66K | 6.35K | 2.84K | 3.00K | 3.46K | 3.79K | 5.45K | 9.56K | 38.51K | 1.15K | 21.64K | 0.00 | 0.00 | 0.00 | 0.00 | 0.00 | 0.00 |
| Depreciation & Amortization | 17.71K | 57.88K | 38.61K | 46.56K | 32.74K | 5.12K | 1.28K | 1.60K | 2.00K | 31.19K | 44.75K | 58.93K | 52.19K | 33.28K | 41.41K | 107.08K | 30.94K | 18.69K | 18.62K | 18.03K | 16.74K | 17.94K | 16.84K |
| EBITDA | -940.45K | -811.15K | -1.37M | -886.30K | -557.69K | -1.22M | -1.71M | -1.03M | -140.01K | -718.92K | -952.33K | -1.91M | -3.32M | 1.01M | -1.70M | -2.32M | -1.75M | -1.42M | -543.63K | -1.43M | -1.43M | -1.01M | -238.74K |
| EBITDA Ratio | 0.00% | 0.00% | 0.00% | 0.00% | 0.00% | 0.00% | 0.00% | 0.00% | 0.00% | 0.00% | 0.00% | 0.00% | 0.00% | 0.00% | 0.00% | 0.00% | 0.00% | 0.00% | 0.00% | 0.00% | 0.00% | 0.00% | 0.00% |
| Operating Income | -1.02M | -869.03K | -1.41M | -932.86K | -614.66K | -1.27M | -1.86M | -1.03M | -334.86K | -781.27K | -1.18M | -1.88M | -2.97M | -1.70M | -1.79M | -2.65M | -2.09M | -1.72M | -1.41M | -1.89M | -1.44M | -1.36M | -1.18M |
| Operating Income Ratio | 0.00% | 0.00% | 0.00% | 0.00% | 0.00% | 0.00% | 0.00% | 0.00% | 0.00% | 0.00% | 0.00% | 0.00% | 0.00% | 0.00% | 0.00% | 0.00% | 0.00% | 0.00% | 0.00% | 0.00% | 0.00% | 0.00% | 0.00% |
| Total Other Income/Expenses | 359.33K | 100.67K | 97.52K | 107.04K | -105.57K | -90.88K | 408.22K | 872.96K | -1.44M | -10.40M | 283.55K | -458.68K | -2.02M | -2.46M | -2.03M | -3.55M | 746.02K | 181.70K | -318.94K | -112.90K | 123.70K | -6.64K | -337.96K |
| Income Before Tax | -657.66K | -650.41K | -1.18M | -719.40K | -631.48K | -1.31M | -1.40M | -84.25K | -1.64M | -11.18M | -899.97K | -2.34M | -4.99M | -4.15M | -3.82M | -6.19M | -1.35M | -1.53M | -1.73M | -2.01M | -1.32M | -1.37M | -1.52M |
| Income Before Tax Ratio | 0.00% | 0.00% | 0.00% | 0.00% | 0.00% | 0.00% | 0.00% | 0.00% | 0.00% | 0.00% | 0.00% | 0.00% | 0.00% | 0.00% | 0.00% | 0.00% | 0.00% | 0.00% | 0.00% | 0.00% | 0.00% | 0.00% | 0.00% |
| Income Tax Expense | 0.00 | -2.00 | 4.00 | -190.00K | -1.00 | -166.74K | 0.00 | 0.00 | 0.00 | -139.99K | -60.28K | -99.87K | -428.65K | 2.63M | -265.50K | -920.00K | -462.52K | -302.99K | -387.65K | 336.89K | -42.82K | 286.52K | 828.60K |
| Net Income | -660.00K | -650.00K | -1.18M | -720.00K | -630.00K | -1.31M | -1.40M | -84.25K | -1.64M | -11.18M | -899.97K | -2.34M | -4.99M | -4.32M | -771.02K | -5.35M | -883.38K | -1.23M | -1.34M | -1.89M | -1.28M | -1.32M | -1.42M |
| Net Income Ratio | 0.00% | 0.00% | 0.00% | 0.00% | 0.00% | 0.00% | 0.00% | 0.00% | 0.00% | 0.00% | 0.00% | 0.00% | 0.00% | 0.00% | 0.00% | 0.00% | 0.00% | 0.00% | 0.00% | 0.00% | 0.00% | 0.00% | 0.00% |
| EPS | -0.01 | -0.01 | -0.02 | -0.03 | -0.02 | -0.02 | -0.02 | 0.00 | -0.09 | -0.71 | -0.07 | -0.20 | -0.46 | -0.56 | -0.11 | -0.78 | -0.15 | -0.29 | -0.35 | -0.54 | -0.40 | -0.57 | -0.63 |
| EPS Diluted | -0.01 | -0.01 | -0.02 | -0.03 | -0.02 | -0.02 | -0.02 | 0.00 | -0.09 | -0.71 | -0.07 | -0.20 | -0.46 | -0.56 | -0.11 | -0.78 | -0.15 | -0.29 | -0.35 | -0.54 | -0.40 | -0.57 | -0.63 |
| Weighted Avg Shares Out | 55.55M | 55.53M | 52.25M | 27.75M | 25.81M | 83.33M | 70.20M | 33.19M | 18.42M | 15.82M | 12.32M | 11.56M | 10.81M | 7.71M | 6.96M | 6.86M | 5.93M | 4.19M | 3.84M | 3.53M | 3.20M | 2.31M | 2.26M |
| Weighted Avg Shares Out (Dil) | 55.54M | 55.53M | 52.25M | 27.75M | 25.81M | 83.33M | 70.20M | 33.19M | 18.42M | 15.82M | 12.32M | 11.56M | 10.81M | 7.71M | 6.99M | 6.86M | 5.93M | 4.19M | 3.89M | 3.54M | 3.20M | 2.34M | 2.26M |

Comparing Metals Acquisition (NYSE:MTAL) and New Age Metals (OTCMKTS:NMTLF)
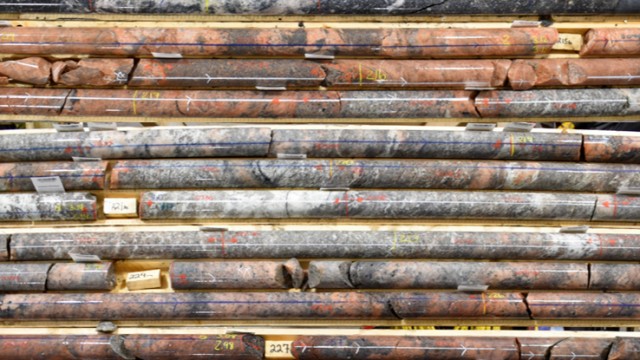
New Age Metals reports encouraging drill results at Lithium Two

New Age Metals receives $300K grant from Manitoba Mineral Development Fund

New Age Metals secures $2M interim budget for Manitoba lithium projects summer/fall exploration programs
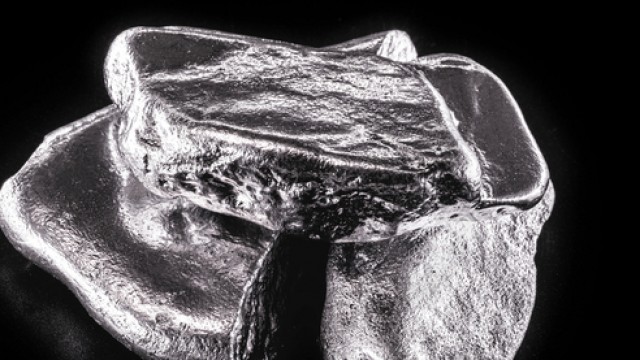
New Age Metals releases encouraging results from rhodium study at River Valley palladium project
New Age Metals adds new project at Red Cross Lake in Manitoba and expands lithium division land holdings to 74,448 hectares
New Age Metals expands lithium portfolio with acquisition of McLaughlin Lake lithium project in Manitoba
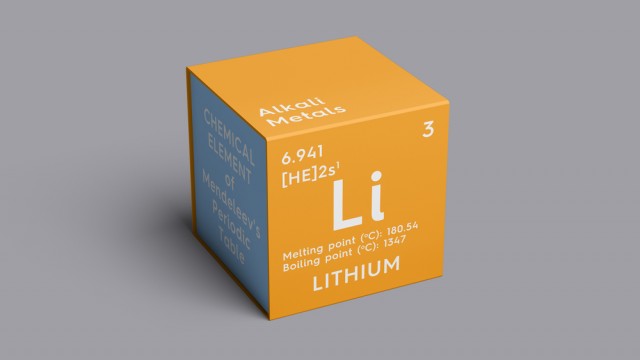
New Age Metals to drill additional 1500m at Lithium Two project; provides exploration update
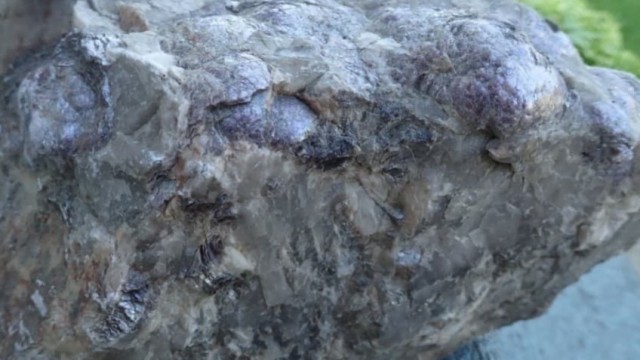
New Age Metals acquires new LCT pegmatite property in Northern Manitoba
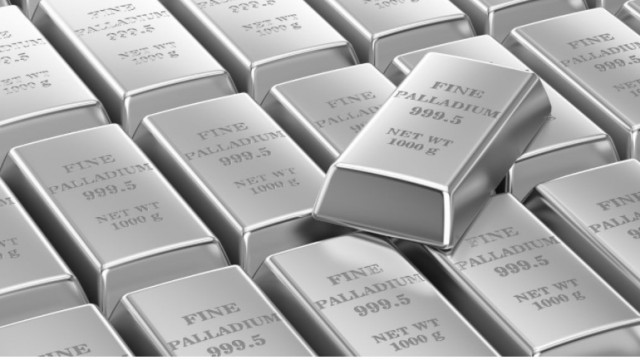
New Age Metals reports promising palladium-platinum-gold and copper results from diamond drilling program at River Valley palladium project
Source: https://incomestatements.info
Category: Stock Reports
