See more : Cerrado Gold Inc. (CRDOF) Income Statement Analysis – Financial Results
Complete financial analysis of Nippon Steel Corporation (NPSCY) income statement, including revenue, profit margins, EPS and key performance metrics. Get detailed insights into the financial performance of Nippon Steel Corporation, a leading company in the Steel industry within the Basic Materials sector.
- Saga plc (SAGA.L) Income Statement Analysis – Financial Results
- Profitable Developments, Inc. (PRDL) Income Statement Analysis – Financial Results
- Livent Corporation (LTHM) Income Statement Analysis – Financial Results
- K-TIG Limited (KTG.AX) Income Statement Analysis – Financial Results
- NICO Resources Limited (NICOF) Income Statement Analysis – Financial Results
Nippon Steel Corporation (NPSCY)
About Nippon Steel Corporation
Nippon Steel Corporation, together with its subsidiaries, engages in steelmaking and steel fabrication, engineering and construction, chemicals and materials, and system solutions businesses in Japan and internationally. The company's steelmaking and steel fabrication business offers steel plates, sheets, and slags; bar and rod materials; structural steel; pipes and tubes; titanium and stainless products; and railway, automotive, and machinery parts for applications in automotive, energy, infrastructure, and consumer electronics markets. Its engineering and construction business cover the manufacture and sale of industrial machinery; equipment and steel structures; construction projects under contract; waste processing and recycling; and supply of electricity, gas, and heat. The company's chemicals and materials comprise the manufacture and sale of coal-based chemical products, petrochemicals, electronic materials, materials and components for semiconductors and electronic parts, carbon fiber and composite products, and products that utilize technologies for metal processing. Its system solutions business includes computer systems engineering and consulting services; and IT-enabled outsourcing and other services. The company was formerly known as Nippon Steel & Sumitomo Metal Corporation and changed its name to Nippon Steel Corporation in April 2019. Nippon Steel Corporation was founded in 1950 and is headquartered in Tokyo, Japan.
| Metric | 2024 | 2023 | 2022 | 2021 | 2020 | 2019 | 2018 | 2017 | 2016 | 2015 | 2014 | 2013 | 2012 | 2011 | 2010 | 2009 | 2008 | 2007 | 2006 | 2005 | 2004 | 2003 | 2002 | 2001 | 2000 |
|---|---|---|---|---|---|---|---|---|---|---|---|---|---|---|---|---|---|---|---|---|---|---|---|---|---|
| Revenue | 8,868.10B | 7,975.59B | 6,808.89B | 4,829.27B | 5,921.53B | 6,177.95B | 5,712.97B | 4,632.89B | 4,907.43B | 5,610.03B | 5,516.18B | 4,389.92B | 4,090.94B | 4,109.77B | 3,487.71B | 4,769.82B | 4,826.97B | 4,302.15B | 3,906.30B | 3,389.36B | 2,925.88B | 2,749.31B | 2,581.40B | 2,750.42B | 2,680.61B |
| Cost of Revenue | 7,481.33B | 6,693.35B | 5,595.22B | 4,268.37B | 5,307.71B | 5,386.76B | 4,945.90B | 4,064.06B | 4,287.99B | 4,801.78B | 4,760.31B | 3,982.36B | 3,678.64B | 3,624.99B | 3,156.50B | 4,105.78B | 3,952.98B | 3,408.20B | 3,063.15B | 2,693.60B | 2,443.19B | 2,351.03B | 2,245.34B | 2,305.54B | 2,265.38B |
| Gross Profit | 1,386.77B | 1,282.23B | 1,213.67B | 560.91B | 613.82B | 791.18B | 767.07B | 568.83B | 619.44B | 808.25B | 755.87B | 407.56B | 412.30B | 484.79B | 331.22B | 664.04B | 874.00B | 893.95B | 843.15B | 695.75B | 482.69B | 398.28B | 336.06B | 444.88B | 415.24B |
| Gross Profit Ratio | 15.64% | 16.08% | 17.82% | 11.61% | 10.37% | 12.81% | 13.43% | 12.28% | 12.62% | 14.41% | 13.70% | 9.28% | 10.08% | 11.80% | 9.50% | 13.92% | 18.11% | 20.78% | 21.58% | 20.53% | 16.50% | 14.49% | 13.02% | 16.17% | 15.49% |
| Research & Development | 0.00 | 70.56B | 66.43B | 65.34B | 77.69B | 72.04B | 74.07B | 69.11B | 68.40B | 62.97B | 64.44B | 60.07B | 0.00 | 0.00 | 0.00 | 0.00 | 33.42B | 31.40B | 0.00 | 0.00 | 0.00 | 0.00 | 0.00 | 0.00 | 0.00 |
| General & Administrative | 730.39B | 579.41B | 544.73B | 469.13B | 571.78B | 568.41B | 533.79B | 0.00 | 276.02B | 276.82B | 262.27B | 230.30B | 230.30B | 213.33B | 198.68B | 202.14B | 201.18B | 87.56B | 266.83B | 265.81B | 258.22B | 255.32B | 263.02B | 282.23B | 294.94B |
| Selling & Marketing | 0.00 | -81.88B | -74.32B | 129.42B | 155.87B | -67.31B | -71.08B | 0.00 | 107.28B | 116.15B | 125.02B | 95.50B | 102.63B | 105.85B | 100.53B | 118.97B | 127.24B | 0.00 | 0.00 | 0.00 | 0.00 | 0.00 | 0.00 | 0.00 | 0.00 |
| SG&A | 730.39B | 497.53B | 470.41B | 399.37B | 498.75B | 501.10B | 462.70B | 385.52B | 383.30B | 392.97B | 387.30B | 325.80B | 332.93B | 319.18B | 299.21B | 321.11B | 328.42B | 87.56B | 266.83B | 265.81B | 258.22B | 255.32B | 263.02B | 282.23B | 294.94B |
| Other Expenses | -122.28B | 0.00 | 0.00 | 0.00 | 0.00 | 0.00 | 8.70B | -2.27B | 531.00M | -1.15B | -2.20B | 1.81B | 17.23B | -1.58B | -36.93B | -32.72B | -3.83B | 0.00 | -9.44B | -49.52B | -133.13B | 0.00 | -72.27B | -83.64B | -79.87B |
| Operating Expenses | 608.10B | 568.09B | 536.84B | 464.71B | 576.44B | 573.14B | 536.78B | 454.63B | 451.70B | 458.74B | 457.48B | 387.45B | 332.93B | 319.18B | 299.21B | 321.11B | 328.42B | 313.85B | 266.83B | 265.81B | 258.22B | 255.32B | 263.02B | 282.24B | 294.94B |
| Cost & Expenses | 8,089.44B | 7,261.44B | 6,132.06B | 4,733.07B | 5,884.15B | 5,959.90B | 5,482.67B | 4,518.69B | 4,739.70B | 5,260.52B | 5,217.79B | 4,369.81B | 4,011.57B | 3,944.17B | 3,455.71B | 4,426.89B | 4,281.39B | 3,722.05B | 3,329.98B | 2,959.41B | 2,701.40B | 2,606.34B | 2,508.36B | 2,587.77B | 2,560.31B |
| Interest Income | 21.54B | 8.07B | 1.92B | 5.36B | 7.70B | 6.03B | 5.71B | 5.65B | 5.70B | 5.29B | 4.52B | 3.87B | 3.30B | 2.75B | 1.80B | 3.97B | 5.13B | 23.43B | 14.51B | 9.34B | 6.10B | 5.53B | 7.05B | 9.61B | 9.28B |
| Interest Expense | 36.23B | 24.89B | 26.25B | 25.40B | 25.16B | 22.45B | 24.58B | 18.01B | 20.11B | 19.92B | 25.30B | 23.54B | 17.83B | 18.36B | 19.80B | 19.81B | 17.77B | 15.22B | 15.79B | 20.28B | 23.80B | 29.19B | 32.90B | 39.22B | 47.54B |
| Depreciation & Amortization | 363.00B | 340.17B | 330.61B | 290.86B | 417.34B | 408.62B | 366.57B | 311.21B | 315.34B | 329.15B | 341.51B | 294.82B | 284.43B | 293.21B | 287.72B | 274.85B | 247.05B | 191.39B | 183.37B | 180.57B | 183.51B | 196.65B | 197.34B | 206.99B | 214.19B |
| EBITDA | 1,163.20B | 1,231.91B | 1,007.45B | 382.29B | 454.72B | 679.83B | 596.86B | 425.41B | 483.07B | 678.66B | 639.90B | 373.27B | 422.32B | 496.94B | 318.77B | 647.91B | 870.30B | 828.02B | 764.76B | 642.79B | 425.94B | 324.72B | 205.16B | 380.58B | 351.13B |
| EBITDA Ratio | 13.12% | 13.22% | 14.80% | 8.01% | 7.68% | 10.14% | 10.45% | 9.18% | 9.84% | 13.65% | 12.78% | 8.50% | 11.02% | 13.09% | 9.16% | 13.58% | 17.54% | 19.49% | 20.54% | 18.96% | 14.56% | 11.81% | 10.26% | 13.84% | 13.10% |
| Operating Income | 778.66B | 714.15B | 676.83B | 96.20B | 37.38B | 218.05B | 230.30B | 114.20B | 167.73B | 349.51B | 298.39B | 20.11B | 79.36B | 165.61B | 32.01B | 342.93B | 545.58B | 580.10B | 576.32B | 429.95B | 224.48B | 142.96B | 73.04B | 162.64B | 120.30B |
| Operating Income Ratio | 8.78% | 8.95% | 9.94% | 1.99% | 0.63% | 3.53% | 4.03% | 2.47% | 3.42% | 6.23% | 5.41% | 0.46% | 1.94% | 4.03% | 0.92% | 7.19% | 11.30% | 13.48% | 14.75% | 12.69% | 7.67% | 5.20% | 2.83% | 5.91% | 4.49% |
| Total Other Income/Expenses | -14.69B | -16.80B | -24.32B | -104.86B | -460.95B | -16.34B | -16.94B | -28.35B | 63.05B | 26.68B | 100.76B | -157.08B | 40.69B | 19.77B | -20.76B | -61.85B | 59.91B | 41.32B | -10.71B | -60.46B | -150.83B | -180.35B | -98.12B | -113.24B | -118.13B |
| Income Before Tax | 763.97B | 763.93B | 602.10B | -8.66B | -423.57B | 248.77B | 271.76B | 181.69B | 230.78B | 376.19B | 399.15B | -136.97B | 120.05B | 185.38B | 11.24B | 281.08B | 605.49B | 621.42B | 565.61B | 369.49B | 73.64B | -37.39B | -25.08B | 49.40B | 2.17B |
| Income Before Tax Ratio | 8.61% | 9.58% | 8.84% | -0.18% | -7.15% | 4.03% | 4.76% | 3.92% | 4.70% | 6.71% | 7.24% | -3.12% | 2.93% | 4.51% | 0.32% | 5.89% | 12.54% | 14.44% | 14.48% | 10.90% | 2.52% | -1.36% | -0.97% | 1.80% | 0.08% |
| Income Tax Expense | 176.07B | 128.12B | 149.05B | 10.67B | 2.55B | -8.81B | 59.55B | 35.70B | 79.23B | 145.95B | 140.57B | -25.60B | 52.30B | 76.21B | 16.04B | 113.36B | 223.50B | 248.60B | 206.19B | 137.21B | 26.60B | 9.26B | 3.81B | 19.57B | -6.87B |
| Net Income | 549.37B | 694.02B | 637.32B | -32.43B | -431.51B | 251.17B | 180.83B | 130.95B | 145.42B | 214.29B | 242.75B | -124.57B | 58.47B | 93.20B | -11.53B | 155.08B | 354.99B | 351.18B | 343.90B | 220.60B | 41.52B | -51.69B | -28.40B | 26.49B | 11.17B |
| Net Income Ratio | 6.19% | 8.70% | 9.36% | -0.67% | -7.29% | 4.07% | 3.17% | 2.83% | 2.96% | 3.82% | 4.40% | -2.84% | 1.43% | 2.27% | -0.33% | 3.25% | 7.35% | 8.16% | 8.80% | 6.51% | 1.42% | -1.88% | -1.10% | 0.96% | 0.42% |
| EPS | 527.96 | 753.66 | 692.16 | -35.22 | -468.74 | 281.77 | 204.88 | 147.97 | 158.72 | 78.27 | 88.90 | -54.10 | 30.97 | 49.37 | -6.11 | 82.00 | 187.77 | 180.93 | 170.23 | 109.10 | 20.50 | -25.58 | -13.91 | 12.97 | 5.47 |
| EPS Diluted | 527.96 | 671.89 | 657.49 | -35.22 | -468.74 | 281.77 | 204.88 | 147.97 | 158.72 | 78.27 | 88.90 | -54.10 | 30.97 | 48.37 | -6.11 | 79.03 | 178.37 | 180.93 | 170.23 | 109.10 | 20.50 | -25.58 | -13.91 | 12.97 | 5.47 |
| Weighted Avg Shares Out | 1.04B | 920.86M | 920.77M | 920.75M | 920.57M | 891.39M | 882.63M | 884.96M | 916.21M | 2.74B | 2.73B | 2.30B | 1.89B | 1.89B | 1.89B | 1.89B | 1.99B | 1.94B | 2.02B | 2.02B | 2.02B | 2.02B | 2.04B | 2.04B | 2.04B |
| Weighted Avg Shares Out (Dil) | 1.04B | 1.03B | 969.32M | 920.75M | 920.57M | 891.39M | 882.63M | 884.96M | 916.21M | 2.74B | 2.73B | 2.30B | 1.89B | 1.93B | 1.89B | 1.96B | 1.99B | 1.94B | 2.02B | 2.02B | 2.02B | 2.02B | 2.04B | 2.04B | 2.04B |

U.S. Steel sale to Nippon Steel an issue of national defense, critical supply chains: USW president
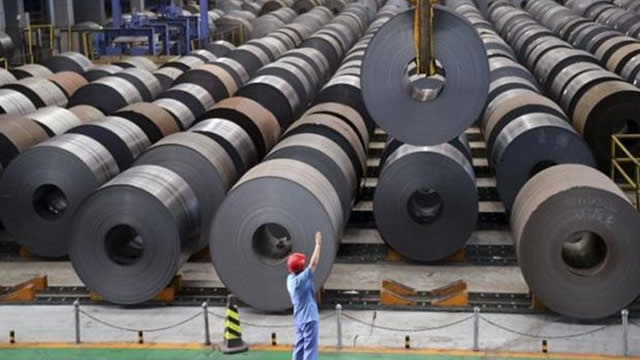
Trump to reiterate pledge to block Nippon Steel's planned purchase of U.S. Steel
Biden says he hasn't changed his mind on Nippon Steel deal
Arbitration board gives green light to US Steel-Nippon Steel merger over union's objections
US Steel says arbitration board rules in favor of Nippon Steel's $14.9 bln buyout deal
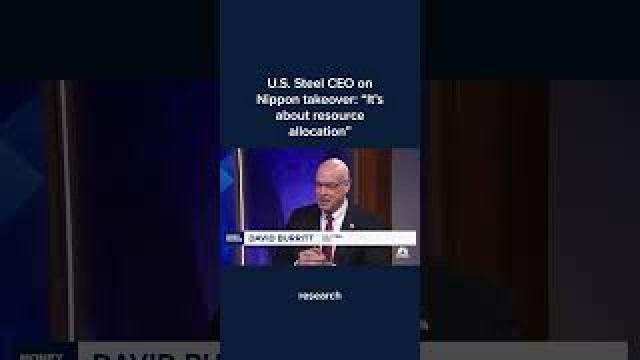
U.S. Steel CEO on Nippon takeover: 'It's about resource allocation'
U.S. Steel CEO defends planned sale to Japan's Nippon, believes deal will ‘close on its merits'

U.S. Steel CEO defends sale to Nippon, says deal will 'win on its merits'
Nippon Steel's Mori asks USW leadership to 'come to the table'
U.S. Steel's stock up 2% after offering strong guidance and confidence Nippon deal can close by year-end
Source: https://incomestatements.info
Category: Stock Reports
