See more : Impellam Group plc (IGPPF) Income Statement Analysis – Financial Results
Complete financial analysis of Naturally Splendid Enterprises Ltd. (NSPDF) income statement, including revenue, profit margins, EPS and key performance metrics. Get detailed insights into the financial performance of Naturally Splendid Enterprises Ltd., a leading company in the Biotechnology industry within the Healthcare sector.
- 1Spatial Plc (SPA.L) Income Statement Analysis – Financial Results
- IR Japan Holdings, Ltd. (6035.T) Income Statement Analysis – Financial Results
- Ravad Ltd (RAVD.TA) Income Statement Analysis – Financial Results
- Olympic Cards Limited (OLPCL.BO) Income Statement Analysis – Financial Results
- Ming Yuan Cloud Group Holdings Limited (0909.HK) Income Statement Analysis – Financial Results
Naturally Splendid Enterprises Ltd. (NSPDF)
About Naturally Splendid Enterprises Ltd.
Naturally Splendid Enterprises Ltd. develops, produces, commercializes, and sells plant-derived, bio-active ingredients, nutrient dense foods, and related products in Canada. The company offers nutrition for athletes under the Natera Sport brand; mushroom fortified bars under the Woods Wild; protein bars under the Elevate Me brand; Hemp Foods under the CHII brand; products for dogs under the PawsitiveFX brand; and health and wellness products under the Natera FX brand, as well as products for the equestrian market under the Timer's Nutrition brand. It also develops, manufactures, and distributes healthy lifestyle and meal replacement products. The company sells food and ingredients to commercial processors and consumers through grocery stores, health and nutrition stores, and online. It exports its products to the United States, Australia, and South Korea. Naturally Splendid Enterprises Ltd. is headquartered in Pitt Meadows, Canada.
| Metric | 2022 | 2021 | 2020 | 2019 | 2018 | 2017 | 2016 | 2015 | 2014 | 2013 | 2012 | 2011 |
|---|---|---|---|---|---|---|---|---|---|---|---|---|
| Revenue | 0.00 | 763.80K | 1.58M | 3.04M | 2.07M | 1.77M | 7.35M | 301.71K | 234.76K | 132.58K | 99.66K | 0.00 |
| Cost of Revenue | 0.00 | 681.62K | 1.46M | 2.11M | 1.55M | 1.51M | 6.11M | 244.55K | 193.09K | 107.91K | 69.79K | 0.00 |
| Gross Profit | 0.00 | 82.18K | 116.13K | 922.80K | 524.12K | 263.92K | 1.23M | 57.16K | 41.67K | 24.67K | 29.87K | 0.00 |
| Gross Profit Ratio | 0.00% | 10.76% | 7.37% | 30.38% | 25.27% | 14.88% | 16.80% | 18.94% | 17.75% | 18.61% | 29.97% | 0.00% |
| Research & Development | 0.00 | 12.06K | 0.00 | 14.80K | 11.66K | 167.32K | 36.01K | 154.74K | 7.94K | 24.30K | 18.75K | 0.00 |
| General & Administrative | 0.00 | 1.66M | 2.15M | 3.05M | 4.86M | 4.20M | 2.84M | 3.14M | 1.25M | 906.47K | 126.53K | 110.52K |
| Selling & Marketing | 0.00 | 591.97K | 1.47M | 2.26M | 1.06M | 119.19K | 538.82K | 901.69K | 521.94K | 496.06K | 280.00 | 392.00 |
| SG&A | 0.00 | 2.25M | 3.62M | 5.31M | 5.93M | 4.32M | 3.38M | 4.04M | 1.77M | 1.40M | 126.81K | 110.91K |
| Other Expenses | 0.00 | -141.12K | -220.47K | -130.00K | -565.00K | 161.73K | 51.31K | 0.00 | 0.00 | 0.00 | 0.00 | 0.00 |
| Operating Expenses | 0.00 | 2.83M | 4.26M | 6.24M | 6.39M | 4.83M | 3.65M | 4.33M | 1.83M | 1.44M | 126.81K | 110.91K |
| Cost & Expenses | 0.00 | 3.51M | 5.72M | 8.35M | 7.94M | 6.34M | 9.77M | 4.57M | 2.03M | 1.55M | 126.81K | 110.91K |
| Interest Income | 0.00 | 300.00 | 368.00 | 5.86K | 11.20K | 0.00 | 907.00 | 1.73K | 2.84K | 5.72K | 633.00 | 685.00 |
| Interest Expense | 0.00 | 305.51K | 290.21K | 301.85K | 35.22K | 100.32K | 269.26K | 50.10K | 4.90K | 3.35K | 159.00 | 290.00 |
| Depreciation & Amortization | 228.49K | 566.30K | 642.80K | 910.89K | 452.74K | 300.84K | 237.62K | 134.66K | 30.37K | 17.41K | 6.64K | 290.00 |
| EBITDA | 0.00 | -2.27M | -3.73M | -4.53M | -5.40M | -4.02M | -2.27M | -4.13M | -1.76M | -1.40M | -126.18K | -110.91K |
| EBITDA Ratio | 0.00% | -285.81% | -222.04% | -149.11% | -260.51% | -238.19% | -29.67% | -1,370.10% | -749.47% | -1,053.29% | -126.61% | 0.00% |
| Operating Income | 0.00 | -2.75M | -4.14M | -5.44M | -5.86M | -5.02M | -2.85M | -4.32M | -1.80M | -1.42M | -126.97K | -111.20K |
| Operating Income Ratio | 0.00% | -359.95% | -262.82% | -179.09% | -282.34% | -282.84% | -38.73% | -1,431.92% | -765.70% | -1,073.27% | -127.40% | 0.00% |
| Total Other Income/Expenses | 0.00 | -392.36K | -516.22K | -1.71M | -871.13K | -253.31K | -504.37K | -2.92M | 1.81K | -1.32M | 633.00 | 685.00 |
| Income Before Tax | 0.00 | -3.14M | -4.66M | -7.03M | -6.73M | -4.86M | -2.78M | -6.98M | -1.80M | -2.75M | -126.34K | -110.51K |
| Income Before Tax Ratio | 0.00% | -411.36% | -295.59% | -231.44% | -324.35% | -274.08% | -37.78% | -2,313.94% | -764.93% | -2,070.53% | -126.77% | 0.00% |
| Income Tax Expense | 0.00 | 305.51K | 290.21K | 171.85K | -43.65K | -43.81K | 116.30K | -58.97K | 4.90K | 3.35K | 189.41K | -685.00 |
| Net Income | 0.00 | -3.14M | -4.66M | -7.03M | -1.60M | -4.58M | -2.62M | -6.87M | -1.80M | -2.75M | -126.34K | -110.51K |
| Net Income Ratio | 0.00% | -411.36% | -295.59% | -231.44% | -76.97% | -258.07% | -35.70% | -2,277.79% | -764.93% | -2,070.53% | -126.77% | 0.00% |
| EPS | 0.00 | -0.22 | -0.41 | -0.88 | -0.24 | -0.89 | -0.65 | -2.00 | -0.89 | -1.67 | -0.95 | -1.30 |
| EPS Diluted | 0.00 | -0.22 | -0.41 | -0.88 | -0.24 | -0.89 | -0.65 | -2.00 | -0.89 | -1.67 | -0.95 | -1.30 |
| Weighted Avg Shares Out | 0.00 | 14.56M | 11.42M | 7.96M | 6.62M | 5.17M | 4.03M | 3.44M | 2.01M | 1.64M | 133.33K | 84.75K |
| Weighted Avg Shares Out (Dil) | 0.00 | 14.56M | 11.42M | 7.96M | 6.62M | 5.17M | 4.03M | 3.44M | 2.01M | 1.64M | 133.33K | 84.75K |

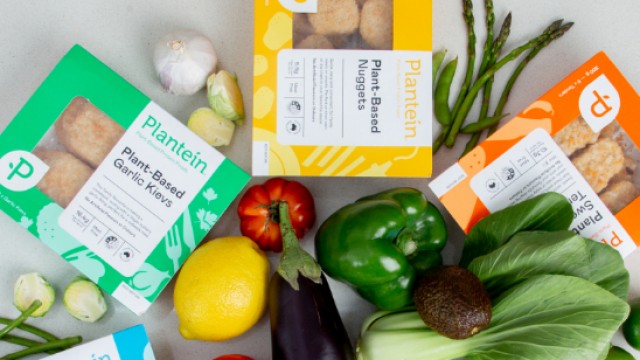
Naturally Splendid Enterprises continues to penetrate plant-based market; Quality Foods and CASECO to carry its plantein products

Naturally Splendid Enterprises continues to focus on sales activities of Plantein Plant-Based Foods and slashing overheads

Naturally Splendid dished up Plantein entrees at Grocery Innovations Canada trade show

Naturally Splendid Enterprises reveals extensive distribution network for its Plantein line of plant-based foods

Naturally Splendid announces Plantein entrees will be available at Vancouver Giants games at the Langley Event Centre

Naturally Splendid Enterprises launches purchasing program for its Plantein entrees with Greenbridge Foodservice

Naturally Splendid says Gordon Food Service to distribute Plantein products

Naturally Splendid says Vegan Supply to distribute Plantein products through its foodservice network, e-commerce platform and in-store

Naturally Splendid's Plantein entrees listed nationwide by wholesale distributor Sysco Canada

Naturally Splendid Enterprises reports results for six months ended June 30, 2022; announces strategic update
Source: https://incomestatements.info
Category: Stock Reports
