See more : Airway Medix S.A. (AWM.WA) Income Statement Analysis – Financial Results
Complete financial analysis of Neste Oyj (NTOIF) income statement, including revenue, profit margins, EPS and key performance metrics. Get detailed insights into the financial performance of Neste Oyj, a leading company in the Oil & Gas Refining & Marketing industry within the Energy sector.
- Enbridge Inc. (EBBNF) Income Statement Analysis – Financial Results
- HUYA Inc. (0YB1.L) Income Statement Analysis – Financial Results
- China Great Wall Securities Co.,Ltd. (002939.SZ) Income Statement Analysis – Financial Results
- Agree Realty Corporation (ADC) Income Statement Analysis – Financial Results
- CL Group (Holdings) Limited (8098.HK) Income Statement Analysis – Financial Results
Neste Oyj (NTOIF)
About Neste Oyj
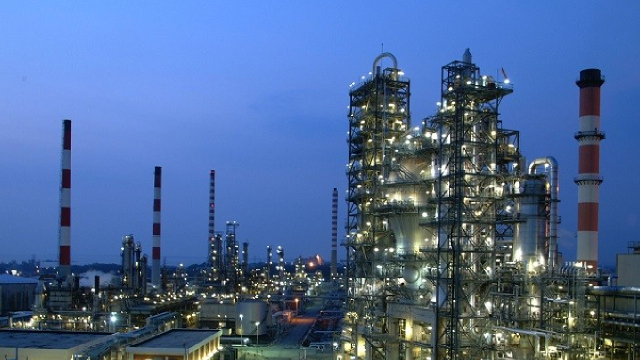
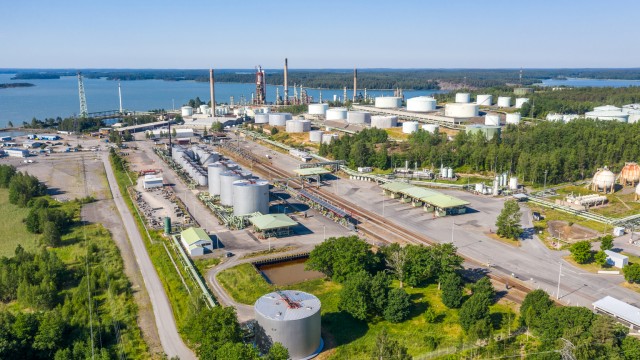
Neste Oyj provides renewable and oil products in Finland and other Nordic countries, Baltic Rim, other European countries, North and South America, and internationally. The company operates in four segments: Renewable Products, Oil Products, Marketing & Services, and Others. The Renewable Products segment produces, markets, and sells renewable diesel, renewable jet fuels and solutions, and renewable solvents, as well as raw material for bioplastics based on its technology to wholesale markets. The Oil Products segment produces, markets, and sells diesel fuel, gasoline, aviation and marine fuels, light and heavy fuel oils, base oils, gasoline components, small engine gasoline, solvents, liquid gases, and bitumen. This segment serves retailers and distributors, oil majors and trading companies, petrochemicals companies, and companies marketing lubricants and solvents. The Marketing & Services segment markets and sells petroleum products and associated services to private motorists, industry, transport companies, farmers, and heating oil customers through a network of 947 service stations, as well as direct sales. The Others segment offers engineering and technology solutions. The company also manufactures raw materials for polymers and chemicals materials. The company was formerly known as Neste Oil Oyj and changed its name to Neste Oyj in June 2015. Neste Oyj was founded in 1948 and is headquartered in Espoo, Finland.
| Metric | 2023 | 2022 | 2021 | 2020 | 2019 | 2018 | 2017 | 2016 | 2015 | 2014 | 2013 | 2012 | 2011 | 2010 | 2009 | 2008 | 2007 | 2006 | 2005 | 2003 | 2002 |
|---|---|---|---|---|---|---|---|---|---|---|---|---|---|---|---|---|---|---|---|---|---|
| Revenue | 22.93B | 25.71B | 15.15B | 11.74B | 15.84B | 14.92B | 13.22B | 11.69B | 11.13B | 15.01B | 17.46B | 17.85B | 15.42B | 11.89B | 9.64B | 15.09B | 12.10B | 12.73B | 9.97B | 11.39B | 11.15B |
| Cost of Revenue | 19.96B | 22.29B | 12.34B | 9.93B | 12.74B | 13.07B | 11.30B | 9.89B | 9.90B | 14.26B | 15.75B | 16.52B | 13.96B | 10.49B | 8.17B | 13.66B | 10.28B | 11.18B | 8.44B | 8.58B | 8.69B |
| Gross Profit | 2.96B | 3.42B | 2.81B | 1.81B | 3.10B | 1.85B | 1.92B | 1.80B | 1.24B | 751.00M | 1.72B | 1.34B | 1.46B | 1.40B | 1.47B | 1.43B | 1.82B | 1.55B | 1.53B | 2.81B | 2.46B |
| Gross Profit Ratio | 12.93% | 13.31% | 18.57% | 15.41% | 19.57% | 12.38% | 14.52% | 15.43% | 11.10% | 5.00% | 9.82% | 7.48% | 9.46% | 11.76% | 15.24% | 9.48% | 15.07% | 12.18% | 15.35% | 24.65% | 22.09% |
| Research & Development | 0.00 | 85.00M | 67.00M | 61.00M | 54.00M | 48.00M | 44.00M | 41.00M | 41.00M | 40.00M | 40.00M | 42.00M | 0.00 | 0.00 | 0.00 | 0.00 | 0.00 | 0.00 | 0.00 | 0.00 | 0.00 |
| General & Administrative | 48.00M | 36.00M | 32.00M | 26.00M | 20.00M | 18.00M | 17.00M | 18.00M | 17.00M | 17.00M | 75.00M | 83.00M | 72.00M | 0.00 | 0.00 | 315.00M | -5.37M | -37.27M | -38.00M | 654.00M | 757.00M |
| Selling & Marketing | 647.00M | 0.00 | 0.00 | 0.00 | 0.00 | 0.00 | 0.00 | 0.00 | 0.00 | 0.00 | 0.00 | 0.00 | 0.00 | 0.00 | 0.00 | 0.00 | 114.00M | 122.00M | 112.00M | 0.00 | 0.00 |
| SG&A | 695.00M | 36.00M | 32.00M | 26.00M | 20.00M | 18.00M | 17.00M | 18.00M | 17.00M | 17.00M | 75.00M | 83.00M | 72.00M | 0.00 | 0.00 | 315.00M | 108.64M | 84.73M | 74.00M | 654.00M | 757.00M |
| Other Expenses | 587.00M | 27.00M | 27.00M | 9.00M | 8.00M | 9.00M | 14.00M | 27.00M | 22.00M | 10.00M | 22.00M | 44.00M | -279.00M | 0.00 | -5.00M | -13.00M | 45.00M | 47.00M | 28.00M | 14.00M | 18.00M |
| Operating Expenses | 1.28B | 1.05B | 826.00M | 964.00M | 864.00M | 824.00M | 765.00M | 728.00M | 665.00M | 657.00M | 1.15B | 1.10B | 1.19B | 1.08B | 1.13B | 1.24B | 1.07B | 868.00M | 753.00M | 1.52B | 1.56B |
| Cost & Expenses | 21.25B | 23.34B | 13.16B | 10.90B | 13.60B | 13.90B | 12.06B | 10.61B | 10.56B | 14.92B | 16.89B | 17.62B | 15.15B | 11.57B | 9.30B | 14.90B | 11.35B | 12.05B | 9.20B | 10.10B | 10.25B |
| Interest Income | 45.00M | 9.00M | 3.00M | 4.00M | 10.00M | 7.00M | 4.00M | 4.00M | 2.00M | 3.00M | 2.00M | 3.00M | 4.00M | 4.00M | 44.00M | 8.00M | 8.00M | 7.00M | 16.00M | 76.00M | 79.00M |
| Interest Expense | 122.00M | 53.00M | 47.00M | 42.00M | 46.00M | 43.00M | 42.00M | 60.00M | 77.00M | 65.00M | 78.00M | 81.00M | 72.00M | 34.00M | 10.00M | 8.00M | 37.00M | 18.00M | 26.00M | 320.00M | 357.00M |
| Depreciation & Amortization | 866.00M | 638.00M | 584.00M | 513.00M | 502.00M | 614.00M | 371.00M | 366.00M | 358.00M | 330.00M | 323.00M | 332.00M | 315.00M | 259.00M | 234.00M | 223.00M | 195.00M | 153.00M | 152.00M | 538.00M | 694.00M |
| EBITDA | 2.58B | 2.97B | 2.59B | 1.51B | 2.62B | 1.60B | 1.51B | 1.50B | 1.07B | 473.00M | 962.00M | 649.00M | 589.00M | 589.00M | 574.00M | 409.00M | 996.00M | 1.01B | 1.00B | 2.04B | 2.06B |
| EBITDA Ratio | 11.25% | 11.52% | 17.06% | 12.74% | 16.65% | 10.75% | 11.36% | 12.53% | 8.89% | 2.88% | 5.20% | 3.34% | 3.85% | 4.95% | 5.60% | 2.71% | 8.17% | 6.90% | 9.96% | 17.27% | 15.46% |
| Operating Income | 1.68B | 2.41B | 2.02B | 828.00M | 2.23B | 1.03B | 1.17B | 1.16B | 699.00M | 150.00M | 632.00M | 321.00M | 278.00M | 323.00M | 335.00M | 186.00M | 801.00M | 854.00M | 831.00M | 1.42B | 1.29B |
| Operating Income Ratio | 7.34% | 9.37% | 13.35% | 7.05% | 14.07% | 6.87% | 8.86% | 9.88% | 6.28% | 1.00% | 3.62% | 1.80% | 1.80% | 2.72% | 3.48% | 1.23% | 6.62% | 6.71% | 8.33% | 12.46% | 11.56% |
| Total Other Income/Expenses | -86.00M | -131.00M | -61.00M | -42.00M | -162.00M | -75.00M | -77.00M | -80.00M | -65.00M | -18.00M | -71.00M | -31.00M | -72.00M | -27.00M | -39.00M | -57.00M | -38.00M | -13.00M | -8.00M | -236.00M | -281.00M |
| Income Before Tax | 1.60B | 2.28B | 1.96B | 786.00M | 2.07B | 951.00M | 1.09B | 1.08B | 634.00M | 78.00M | 561.00M | 233.00M | 206.00M | 296.00M | 296.00M | 129.00M | 763.00M | 841.00M | 823.00M | 1.18B | 1.01B |
| Income Before Tax Ratio | 6.96% | 8.87% | 12.95% | 6.69% | 13.05% | 6.37% | 8.28% | 9.20% | 5.70% | 0.52% | 3.21% | 1.31% | 1.34% | 2.49% | 3.07% | 0.86% | 6.30% | 6.60% | 8.25% | 10.39% | 9.04% |
| Income Tax Expense | 160.00M | 388.00M | 188.00M | 72.00M | 278.00M | 172.00M | 180.00M | 133.00M | 74.00M | 18.00M | 37.00M | 74.00M | 46.00M | 65.00M | 71.00M | 28.00M | 183.00M | 205.00M | 153.00M | 325.00M | 269.00M |
| Net Income | 1.43B | 1.89B | 1.77B | 712.00M | 1.79B | 775.00M | 911.00M | 939.00M | 558.00M | 57.00M | 523.00M | 157.00M | 158.00M | 229.00M | 221.00M | 97.00M | 577.00M | 631.00M | 667.00M | 769.00M | 666.00M |
| Net Income Ratio | 6.25% | 7.34% | 11.69% | 6.06% | 11.29% | 5.19% | 6.89% | 8.03% | 5.01% | 0.38% | 3.00% | 0.88% | 1.02% | 1.93% | 2.29% | 0.64% | 4.77% | 4.96% | 6.69% | 6.75% | 5.97% |
| EPS | 1.87 | 2.46 | 2.31 | 0.93 | 2.33 | 1.01 | 1.19 | 1.22 | 0.73 | 0.07 | 0.68 | 0.20 | 0.21 | 0.30 | 0.29 | 0.13 | 0.75 | 82.00 | 86.67 | 0.91 | 0.79 |
| EPS Diluted | 1.86 | 2.46 | 2.30 | 0.93 | 2.33 | 1.01 | 1.18 | 1.22 | 0.73 | 0.07 | 0.68 | 0.20 | 0.21 | 0.30 | 0.29 | 0.13 | 0.75 | 82.00 | 86.67 | 0.90 | 0.78 |
| Weighted Avg Shares Out | 768.18M | 768.06M | 767.64M | 767.37M | 767.63M | 767.47M | 767.33M | 767.09M | 766.71M | 766.60M | 767.90M | 767.76M | 767.76M | 767.74M | 767.71M | 767.71M | 767.91M | 769.21M | 769.21M | 846.83M | 845.64M |
| Weighted Avg Shares Out (Dil) | 768.44M | 768.55M | 768.53M | 768.50M | 767.68M | 769.21M | 769.21M | 769.21M | 769.21M | 769.21M | 767.90M | 767.76M | 767.76M | 767.74M | 767.71M | 767.71M | 767.91M | 769.21M | 769.21M | 858.73M | 851.48M |

Neste Oyj: Attractive Valuation Eclipsed By Significant Uncertainty

Neste Oyj (NTOIF) Q3 2024 Earnings Call Transcript

Neste: The Company's Products Include A Huge Growth Product

Neste: A Triple-Digit Potential From Finland Beyond 2024

Oil refiner Neste says CEO Matti Lehmus will be stepping down

Neste: Current Setbacks Will Not Halt Growth

Neste: The Upside Is Still Very Attractive With A 'Buy'

Neste Oyj (NTOIF) Q3 2023 Earnings Call Transcript

Neste Oyj (NTOIF) Q2 2023 Earnings Call Transcript

Neste Oyj (NTOIF) CEO Peter Vanacker on Q3 2020 Results - Earnings Call Transcript
Source: https://incomestatements.info
Category: Stock Reports
