See more : Greenlam Industries Limited (GRNLAMIND.BO) Income Statement Analysis – Financial Results
Complete financial analysis of Nucor Corporation (NUE) income statement, including revenue, profit margins, EPS and key performance metrics. Get detailed insights into the financial performance of Nucor Corporation, a leading company in the Steel industry within the Basic Materials sector.
- Creative Eye Limited (CREATIVEYE.BO) Income Statement Analysis – Financial Results
- Biophytis S.A. (ALBPS.PA) Income Statement Analysis – Financial Results
- Pacific Smiles Group Limited (PSQ.AX) Income Statement Analysis – Financial Results
- McPhy Energy S.A. (MCPHY.PA) Income Statement Analysis – Financial Results
- Nordea Invest European Stars (NDIEUSTKL1.CO) Income Statement Analysis – Financial Results
Nucor Corporation (NUE)
About Nucor Corporation
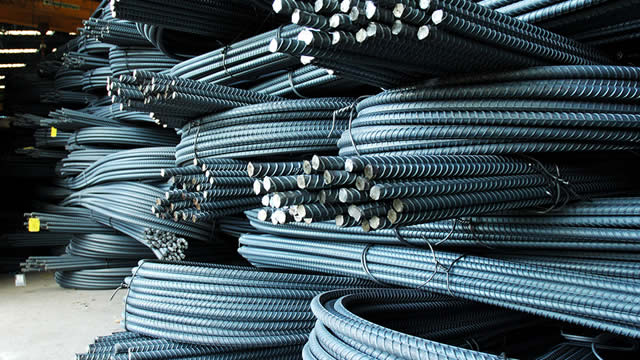
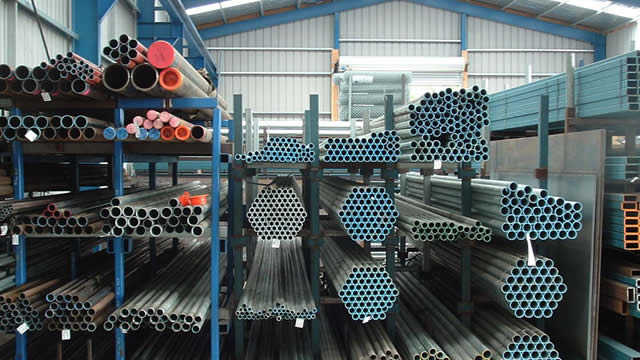
Nucor Corporation manufactures and sells steel and steel products. The company's Steel Mills segment produces hot-rolled, cold-rolled, and galvanized sheet steel products; plate steel products; wide-flange beams, beam blanks, and H-piling and sheet piling products; and bar steel products, such as blooms, billets, concrete reinforcing and merchant bars, and special bar quality products. It also engages in the steel trading and rebar distribution businesses. This segment sells its products to steel service centers, fabricators, and manufacturers in the United States, Canada, and Mexico. Its Steel Products segment offers hollow structural section steel tubing products, electrical conduits, steel racking, steel joists and joist girders, steel decks, fabricated concrete reinforcing steel products, cold finished steel products, steel fasteners, metal building systems, insulated metal panels, steel grating and expanded metal products, and wire and wire mesh products primarily for use in nonresidential construction applications. This segment also engages in the piling distribution business. The company's Raw Materials segment produces direct reduced iron (DRI); brokers ferrous and nonferrous metals, pig iron, hot briquetted iron, and DRI; supplies ferro-alloys; and processes ferrous and nonferrous scrap metal, as well as engages in the natural gas drilling operations. This segment sells its ferrous scrap to electric arc furnace steel mills and foundries for manufacturing process; and nonferrous scrap metal to aluminum can producers, secondary aluminum smelters, steel mills and other processors, and consumers of various nonferrous metals. It serves agriculture, automotive, construction, energy and transmission, oil and gas, heavy equipment, infrastructure, and transportation industries through its in-house sales force; and internal distribution and trading companies. Nucor Corporation was incorporated in 1958 and is based in Charlotte, North Carolina.
| Metric | 2023 | 2022 | 2021 | 2020 | 2019 | 2018 | 2017 | 2016 | 2015 | 2014 | 2013 | 2012 | 2011 | 2010 | 2009 | 2008 | 2007 | 2006 | 2005 | 2004 | 2003 | 2002 | 2001 | 2000 | 1999 | 1998 | 1997 | 1996 | 1995 | 1994 | 1993 | 1992 | 1991 | 1990 | 1989 | 1988 | 1987 | 1986 | 1985 |
|---|---|---|---|---|---|---|---|---|---|---|---|---|---|---|---|---|---|---|---|---|---|---|---|---|---|---|---|---|---|---|---|---|---|---|---|---|---|---|---|
| Revenue | 34.71B | 41.51B | 36.48B | 20.14B | 22.59B | 25.07B | 20.25B | 16.21B | 16.44B | 21.11B | 19.05B | 19.43B | 20.02B | 15.84B | 11.19B | 23.66B | 16.59B | 14.75B | 12.70B | 11.38B | 6.27B | 4.80B | 4.14B | 4.59B | 4.01B | 4.15B | 4.18B | 3.65B | 3.46B | 2.98B | 2.25B | 1.62B | 1.47B | 1.48B | 1.27B | 1.06B | 851.00M | 755.20M | 758.50M |
| Cost of Revenue | 26.89B | 29.01B | 25.46B | 17.91B | 19.91B | 20.77B | 17.68B | 14.18B | 14.86B | 19.20B | 17.64B | 17.92B | 18.07B | 15.00B | 11.04B | 19.61B | 13.46B | 11.28B | 10.09B | 9.13B | 6.00B | 4.33B | 3.82B | 3.93B | 3.22B | 3.34B | 3.36B | 2.96B | 2.73B | 2.33B | 1.84B | 1.32B | 1.21B | 1.21B | 1.03B | 832.90M | 671.50M | 575.50M | 569.70M |
| Gross Profit | 7.82B | 12.50B | 11.03B | 2.23B | 2.68B | 4.30B | 2.57B | 2.03B | 1.58B | 1.91B | 1.41B | 1.51B | 1.95B | 843.67M | 154.39M | 4.05B | 3.13B | 3.47B | 2.62B | 2.25B | 269.28M | 469.50M | 318.95M | 660.67M | 785.40M | 812.50M | 824.40M | 690.00M | 735.70M | 641.50M | 410.20M | 299.60M | 256.30M | 273.50M | 240.30M | 228.50M | 179.50M | 179.70M | 188.80M |
| Gross Profit Ratio | 22.54% | 30.12% | 30.22% | 11.06% | 11.86% | 17.14% | 12.69% | 12.50% | 9.62% | 9.03% | 7.40% | 7.79% | 9.73% | 5.32% | 1.38% | 17.12% | 18.86% | 23.51% | 20.59% | 19.76% | 4.30% | 9.78% | 7.71% | 14.41% | 19.59% | 19.57% | 19.70% | 18.92% | 21.25% | 21.56% | 18.20% | 18.50% | 17.49% | 18.46% | 18.94% | 21.53% | 21.09% | 23.80% | 24.89% |
| Research & Development | 0.00 | 0.00 | 0.00 | 0.00 | 0.00 | 0.00 | 0.00 | 0.00 | 0.00 | 0.00 | 0.00 | 0.00 | 0.00 | 0.00 | 0.00 | 0.00 | 0.00 | 0.00 | 0.00 | 0.00 | 0.00 | 0.00 | 0.00 | 0.00 | 0.00 | 0.00 | 0.00 | 0.00 | 0.00 | 0.00 | 0.00 | 0.00 | 0.00 | 0.00 | 0.00 | 0.00 | 0.00 | 0.00 | 0.00 |
| General & Administrative | 0.00 | 0.00 | 0.00 | 0.00 | 0.00 | 0.00 | 0.00 | 0.00 | 0.00 | 0.00 | 0.00 | 0.00 | 0.00 | 0.00 | 0.00 | 0.00 | 0.00 | 0.00 | 0.00 | 0.00 | 0.00 | 0.00 | 138.56M | 183.18M | 154.80M | 148.00M | 145.40M | 120.40M | 130.70M | 113.40M | 0.00 | 0.00 | 0.00 | 0.00 | 0.00 | 0.00 | 0.00 | 0.00 | 0.00 |
| Selling & Marketing | 0.00 | 0.00 | 0.00 | 0.00 | 0.00 | 0.00 | 0.00 | 0.00 | 0.00 | 0.00 | 0.00 | 0.00 | 0.00 | 0.00 | 0.00 | 0.00 | 0.00 | 0.00 | 0.00 | 0.00 | 0.00 | 0.00 | 0.00 | 0.00 | 0.00 | 0.00 | 0.00 | 0.00 | 0.00 | 0.00 | 0.00 | 0.00 | 0.00 | 0.00 | 0.00 | 0.00 | 0.00 | 0.00 | 0.00 |
| SG&A | 1.58B | 2.00B | 1.71B | 615.04M | 711.25M | 860.72M | 687.53M | 596.76M | 458.99M | 546.20M | 481.90M | 454.90M | 520.65M | 391.38M | 430.82M | 750.98M | 577.76M | 592.47M | 493.56M | 415.03M | 165.37M | 175.59M | 138.56M | 183.18M | 154.80M | 148.00M | 145.40M | 120.40M | 130.70M | 113.40M | 87.60M | 76.80M | 67.00M | 70.50M | 67.00M | 62.10M | 55.40M | 65.90M | 59.10M |
| Other Expenses | 0.00 | 0.00 | 0.00 | 0.00 | 0.00 | 0.00 | 0.00 | 0.00 | 0.00 | 0.00 | 0.00 | 0.00 | 0.00 | 0.00 | 82.34M | 0.00 | 0.00 | 0.00 | 0.00 | 0.00 | 0.00 | 0.00 | 0.00 | 0.00 | 256.60M | 253.10M | 218.80M | 182.20M | 173.90M | 157.70M | 122.30M | 97.80M | 93.60M | 85.00M | 76.60M | 56.30M | 41.80M | 34.90M | 31.10M |
| Operating Expenses | 1.58B | 2.00B | 1.71B | 615.04M | 711.25M | 860.72M | 687.53M | 596.76M | 458.99M | 546.20M | 481.90M | 454.90M | 530.69M | 391.38M | 430.82M | 1.17B | 577.76M | 592.47M | 493.56M | 415.03M | 165.37M | 175.59M | 138.56M | 183.18M | 411.40M | 401.10M | 364.20M | 302.60M | 304.60M | 271.10M | 209.90M | 174.60M | 160.60M | 155.50M | 143.60M | 118.40M | 97.20M | 100.80M | 90.20M |
| Cost & Expenses | 28.47B | 31.01B | 27.17B | 18.53B | 20.62B | 21.63B | 18.37B | 14.78B | 15.32B | 19.74B | 18.12B | 18.37B | 18.61B | 15.39B | 11.47B | 20.78B | 14.04B | 11.88B | 10.58B | 9.54B | 6.16B | 4.51B | 3.96B | 4.11B | 3.64B | 3.74B | 3.72B | 3.26B | 3.03B | 2.61B | 2.05B | 1.49B | 1.37B | 1.36B | 1.17B | 951.30M | 768.70M | 676.30M | 659.90M |
| Interest Income | 275.59M | 48.70M | 4.27M | 13.42M | 35.93M | 25.72M | 13.70M | 11.94M | 4.01M | 4.89M | 5.09M | 11.13M | 12.72M | 8.05M | 15.17M | 44.07M | 0.00 | 0.00 | 0.00 | 0.00 | 0.00 | 0.00 | 0.00 | 0.00 | 0.00 | 0.00 | 0.00 | 0.00 | 0.00 | 0.00 | 0.00 | 0.00 | 0.00 | 0.00 | 0.00 | 0.00 | 0.00 | 0.00 | 0.00 |
| Interest Expense | 245.95M | 170.22M | 158.85M | 153.20M | 121.43M | 135.54M | 173.58M | 169.24M | 173.53M | 169.26M | 146.90M | 162.38M | 166.09M | 153.09M | 134.75M | 134.55M | 0.00 | 0.00 | 0.00 | 0.00 | 0.00 | 0.00 | 0.00 | 0.00 | 0.00 | 0.00 | 0.00 | 0.00 | 0.00 | 0.00 | 0.00 | 0.00 | 0.00 | 0.00 | 0.00 | 0.00 | 0.00 | 0.00 | 0.00 |
| Depreciation & Amortization | 1.17B | 1.06B | 864.56M | 785.47M | 734.65M | 719.64M | 727.06M | 687.05M | 700.02M | 724.42M | 610.21M | 607.02M | 590.40M | 582.60M | 566.42M | 548.91M | 427.56M | 363.94M | 375.05M | 383.31M | 364.11M | 307.10M | 289.06M | 259.37M | 256.60M | 253.10M | 218.80M | 182.20M | 173.90M | 157.70M | 122.30M | 97.80M | 93.60M | 85.00M | 76.60M | 56.30M | 41.80M | 34.90M | 31.10M |
| EBITDA | 7.69B | 11.53B | 10.23B | 1.79B | 2.67B | 4.11B | 2.61B | 2.15B | 1.35B | 2.06B | 1.55B | 1.63B | 2.02B | 1.01B | 302.37M | 3.79B | 2.98B | 3.24B | 2.51B | 2.22B | 468.02M | 601.01M | 469.45M | 903.53M | 630.60M | 664.50M | 679.00M | 569.60M | 605.00M | 528.10M | 322.60M | 222.80M | 189.30M | 203.00M | 173.30M | 166.40M | 124.10M | 113.80M | 129.70M |
| EBITDA Ratio | 22.14% | 27.89% | 28.19% | 11.86% | 11.98% | 16.73% | 13.09% | 13.30% | 11.12% | 9.94% | 8.13% | 8.50% | 10.03% | 6.53% | 2.59% | 14.49% | 17.96% | 21.96% | 19.59% | 19.47% | 7.17% | 11.27% | 11.34% | 16.05% | 15.73% | 15.92% | 16.23% | 15.61% | 17.18% | 17.75% | 14.31% | 13.76% | 12.92% | 13.70% | 13.66% | 15.68% | 14.01% | 13.67% | 15.53% |
| Operating Income | 6.24B | 10.52B | 9.42B | 1.60B | 1.97B | 3.43B | 1.88B | 1.43B | 1.12B | 1.36B | 928.72M | 1.06B | 1.43B | 452.29M | -276.43M | 3.30B | 2.55B | 2.88B | 2.12B | 1.83B | 103.91M | 293.91M | 180.39M | 477.49M | 374.00M | 411.40M | 460.20M | 387.40M | 431.10M | 370.40M | 200.30M | 125.00M | 95.70M | 118.00M | 96.70M | 110.10M | 82.30M | 78.90M | 98.60M |
| Operating Income Ratio | 17.98% | 25.33% | 25.82% | 7.96% | 8.73% | 13.70% | 9.29% | 8.82% | 6.83% | 6.45% | 4.87% | 5.45% | 7.13% | 2.85% | -2.47% | 13.95% | 15.38% | 19.49% | 16.71% | 16.11% | 1.66% | 6.12% | 4.36% | 10.41% | 9.33% | 9.91% | 11.00% | 10.62% | 12.45% | 12.45% | 8.89% | 7.72% | 6.53% | 7.96% | 7.62% | 10.37% | 9.67% | 10.45% | 13.00% |
| Total Other Income/Expenses | 32.78M | -261.26M | -117.95M | -777.37M | -185.03M | -205.30M | -131.92M | -164.19M | -413.04M | -181.14M | -151.60M | -205.70M | -190.08M | -185.18M | -219.89M | -195.67M | -298.97M | -181.76M | -94.96M | -101.65M | -37.03M | -63.86M | -1.02M | 816.10K | 5.20M | 3.90M | 0.00 | 400.00K | 1.20M | -13.50M | -13.20M | -7.70M | 100.00K | -6.70M | -11.10M | -2.50M | 900.00K | 5.30M | 7.60M |
| Income Before Tax | 6.27B | 10.24B | 9.20B | 835.54M | 1.78B | 3.23B | 1.75B | 1.30B | 709.24M | 1.20B | 791.12M | 852.94M | 1.25B | 267.12M | -413.98M | 2.79B | 2.25B | 2.69B | 2.02B | 1.73B | 66.88M | 230.05M | 173.86M | 478.31M | 379.20M | 415.30M | 460.20M | 387.80M | 432.30M | 356.90M | 187.10M | 117.30M | 95.80M | 111.30M | 85.60M | 107.60M | 83.20M | 84.20M | 106.20M |
| Income Before Tax Ratio | 18.07% | 24.68% | 25.22% | 4.15% | 7.89% | 12.88% | 8.64% | 8.01% | 4.31% | 5.71% | 4.15% | 4.39% | 6.25% | 1.69% | -3.70% | 11.79% | 13.58% | 18.26% | 15.88% | 15.22% | 1.07% | 4.79% | 4.20% | 10.43% | 9.46% | 10.00% | 11.00% | 10.63% | 12.49% | 11.99% | 8.30% | 7.24% | 6.54% | 7.51% | 6.75% | 10.14% | 9.78% | 11.15% | 14.00% |
| Income Tax Expense | 1.36B | 2.17B | 2.08B | -490.00K | 411.90M | 748.31M | 369.39M | 398.24M | 213.15M | 388.79M | 205.59M | 259.81M | 390.83M | 60.79M | -176.80M | 959.48M | 781.37M | 936.14M | 706.08M | 609.79M | 4.10M | 67.97M | 60.90M | 167.40M | 134.60M | 151.60M | 165.70M | 139.60M | 157.80M | 130.30M | 63.60M | 38.10M | 31.10M | 36.20M | 27.80M | 36.70M | 32.70M | 37.80M | 47.70M |
| Net Income | 4.52B | 7.61B | 6.83B | 721.47M | 1.27B | 2.36B | 1.32B | 796.27M | 357.66M | 713.95M | 488.03M | 504.62M | 778.19M | 134.09M | -293.61M | 1.83B | 1.47B | 1.76B | 1.31B | 1.12B | 62.78M | 162.08M | 112.96M | 310.91M | 244.60M | 263.70M | 294.50M | 248.20M | 274.50M | 226.60M | 123.50M | 79.20M | 64.70M | 75.10M | 57.80M | 70.90M | 50.50M | 46.40M | 58.50M |
| Net Income Ratio | 13.03% | 18.33% | 18.71% | 3.58% | 5.63% | 9.42% | 6.51% | 4.91% | 2.18% | 3.38% | 2.56% | 2.60% | 3.89% | 0.85% | -2.62% | 7.74% | 8.87% | 11.92% | 10.32% | 9.86% | 1.00% | 3.38% | 2.73% | 6.78% | 6.10% | 6.35% | 7.04% | 6.81% | 7.93% | 7.62% | 5.48% | 4.89% | 4.41% | 5.07% | 4.55% | 6.68% | 5.93% | 6.14% | 7.71% |
| EPS | 18.05 | 28.88 | 23.23 | 2.37 | 4.14 | 7.47 | 4.11 | 2.48 | 1.11 | 2.22 | 1.52 | 1.58 | 2.45 | 0.42 | -0.93 | 6.01 | 4.98 | 5.73 | 4.19 | 3.53 | 0.20 | 0.52 | 0.36 | 0.95 | 0.70 | 0.75 | 0.84 | 0.71 | 0.79 | 0.65 | 0.36 | 0.23 | 0.19 | 0.22 | 0.17 | 0.21 | 0.15 | 0.14 | 0.17 |
| EPS Diluted | 18.00 | 28.79 | 23.16 | 2.36 | 4.14 | 7.45 | 4.10 | 2.48 | 1.11 | 2.22 | 1.52 | 1.58 | 2.45 | 0.42 | -0.93 | 5.98 | 4.94 | 5.68 | 4.15 | 3.50 | 0.20 | 0.52 | 0.36 | 0.95 | 0.70 | 0.75 | 0.84 | 0.71 | 0.79 | 0.65 | 0.36 | 0.23 | 0.19 | 0.22 | 0.17 | 0.21 | 0.15 | 0.14 | 0.17 |
| Weighted Avg Shares Out | 249.77M | 262.35M | 292.49M | 303.17M | 305.04M | 315.86M | 319.99M | 319.56M | 320.57M | 319.84M | 319.08M | 318.17M | 317.00M | 315.96M | 314.87M | 304.53M | 295.57M | 306.59M | 314.38M | 317.70M | 313.91M | 311.69M | 310.83M | 327.27M | 349.43M | 351.60M | 351.64M | 350.81M | 349.68M | 348.62M | 347.89M | 344.35M | 345.07M | 341.36M | 340.00M | 337.62M | 336.67M | 337.45M | 339.13M |
| Weighted Avg Shares Out (Dil) | 250.41M | 263.18M | 293.39M | 303.27M | 305.50M | 316.73M | 320.77M | 319.82M | 320.69M | 320.13M | 319.27M | 318.24M | 317.16M | 316.51M | 314.87M | 306.09M | 297.96M | 309.29M | 317.41M | 320.42M | 313.91M | 313.20M | 311.13M | 327.27M | 349.43M | 351.60M | 351.64M | 350.81M | 349.69M | 348.77M | 347.89M | 344.35M | 345.07M | 341.36M | 340.00M | 337.62M | 336.67M | 337.45M | 339.13M |

Nucor Announces 206th Consecutive Cash Dividend

Nucor (NUE) Stock Falls Amid Market Uptick: What Investors Need to Know

Steel Stocks Rebound: JPMorgan Lifts Ratings On Nucor, Steel Dynamics, US Steel

2 Top Steel Stocks to Buy in September

Nucor (NUE) Sees a More Significant Dip Than Broader Market: Some Facts to Know

Nucor's Stock Down 22% in 6 Months: Should You Buy the Dip?

Is the Options Market Predicting a Spike in Nucor (NUE) Stock?

Stock Market Sell-Off: 3 Stocks You'd Want to Buy on Every Dip

A Quality Exec Comp Plan Lowers The Risk Of Investing In Nucor

51 Annual Dividend Increases! Put This Stock on Your Wish List Now.
Source: https://incomestatements.info
Category: Stock Reports
