See more : Qualigen Therapeutics, Inc. (QLGN) Income Statement Analysis – Financial Results
Complete financial analysis of New York Mortgage Trust, Inc. (NYMTO) income statement, including revenue, profit margins, EPS and key performance metrics. Get detailed insights into the financial performance of New York Mortgage Trust, Inc., a leading company in the REIT – Mortgage industry within the Real Estate sector.
- Dollar General Corporation (DG) Income Statement Analysis – Financial Results
- Zhejiang Jingsheng Mechanical & Electrical Co., Ltd. (300316.SZ) Income Statement Analysis – Financial Results
- Lassonde Industries Inc. (LSDAF) Income Statement Analysis – Financial Results
- Dixon Technologies (India) Limited (DIXON.NS) Income Statement Analysis – Financial Results
- Classic Leasing & Finance Limited (CLFL.BO) Income Statement Analysis – Financial Results
New York Mortgage Trust, Inc. (NYMTO)
About New York Mortgage Trust, Inc.
New York Mortgage Trust, Inc. acquires, invests in, finances, and manages mortgage-related and residential housing-related assets in the United States. Its investment portfolio includes structured multi-family property investments, such as multi-family commercial mortgage-backed securities and preferred equity in, and mezzanine loans to owners of multi-family properties; residential mortgage loans, including distressed residential mortgage loans, non-qualified mortgage loans, second mortgages, residential bridge loans, and other residential mortgage loans; non-agency residential mortgage-backed securities(RMBS); agency RMBS and CMBS; and other mortgage-related, residential housing-related, and credit-related assets. The company qualifies as a real estate investment trust for federal income tax purposes. It generally would not be subject to federal corporate income taxes if it distributes at least 90% of its taxable income to its stockholders. The company was founded in 2003 and is headquartered in New York, New York.
| Metric | 2023 | 2022 | 2021 | 2020 | 2019 | 2018 | 2017 | 2016 | 2015 | 2014 | 2013 | 2012 | 2011 | 2010 | 2009 | 2008 | 2007 | 2006 | 2005 | 2004 | 2003 | 2002 | 2001 | 2000 |
|---|---|---|---|---|---|---|---|---|---|---|---|---|---|---|---|---|---|---|---|---|---|---|---|---|
| Revenue | 210.00M | 8.46M | 266.51M | -207.48M | 221.91M | 142.14M | 121.80M | 105.04M | 123.39M | 188.38M | 90.87M | 40.67M | 15.54M | 15.65M | 20.14M | -12.11M | -9.56M | 4.20M | 49.15M | 40.02M | 4.34M | 1.31M | 281.00K | 149.00K |
| Cost of Revenue | 112.19M | 383.65M | 28.85M | 12.34M | 14.70M | 13.60M | 48.06M | 38.48M | 44.91M | 6.43M | 3.87M | 0.00 | 0.00 | 0.00 | 2.12M | 13.98M | 9.56M | 0.00 | 0.00 | 0.00 | 0.00 | 0.00 | 0.00 | 0.00 |
| Gross Profit | 97.82M | -375.19M | 237.66M | -219.81M | 207.20M | 128.54M | 73.74M | 66.56M | 78.48M | 181.95M | 87.01M | 40.67M | 15.54M | 15.65M | 18.02M | -26.10M | -19.11M | 4.20M | 49.15M | 40.02M | 4.34M | 1.31M | 281.00K | 149.00K |
| Gross Profit Ratio | 46.58% | -4,436.97% | 89.18% | 105.95% | 93.37% | 90.43% | 60.54% | 63.36% | 63.61% | 96.59% | 95.74% | 100.00% | 100.00% | 100.00% | 89.48% | 215.43% | 200.00% | 100.00% | 100.00% | 100.00% | 100.00% | 100.00% | 100.00% | 100.00% |
| Research & Development | 0.00 | -0.80 | 0.78 | -1.94 | 0.23 | 0.22 | 0.22 | 0.20 | 0.00 | 0.00 | 0.00 | 0.00 | 0.00 | 0.00 | 0.00 | 0.00 | 0.00 | 0.00 | 0.00 | 0.00 | 0.00 | 0.00 | 0.00 | 0.00 |
| General & Administrative | 49.57M | 93.33M | 48.91M | 42.23M | 36.37M | 28.23M | 22.87M | 24.51M | 29.12M | 34.03M | 16.05M | 11.39M | 10.52M | 7.95M | 3.89M | 3.48M | 865.00K | 714.00K | 30.98M | 17.12M | 0.00 | 0.00 | 0.00 | 0.00 |
| Selling & Marketing | 0.00 | 0.00 | 0.00 | 0.00 | 0.00 | 0.00 | 0.00 | 0.00 | 0.00 | 0.00 | 0.00 | 0.00 | 0.00 | 0.00 | 0.00 | 0.00 | 145.00K | 78.00K | 4.86M | 3.19M | 1.01M | 488.34K | 0.00 | 0.00 |
| SG&A | 49.57M | 93.33M | 48.91M | 42.23M | 36.37M | 28.23M | 22.87M | 24.51M | 29.12M | 34.03M | 16.05M | 11.39M | 10.52M | 7.95M | 3.89M | 3.48M | 1.01M | 792.00K | 35.84M | 20.31M | 1.01M | 488.34K | 0.00 | 0.00 |
| Other Expenses | 0.00 | 296.12M | -26.67M | -12.34M | -84.96M | 323.77M | 251.13M | -8.41M | 224.88M | 201.97M | 205.95M | 96.62M | 250.00K | 6.05M | 119.00K | 5.28M | 69.99M | 62.21M | 23.16M | -40.63M | 11.64M | 3.62M | 2.89M | 854.00K |
| Operating Expenses | 49.57M | 348.56M | 22.24M | 29.89M | -48.59M | 352.00M | 274.00M | 15.25M | 254.00M | 236.00M | 222.00M | 108.00M | 19.00M | 14.00M | 20.00M | 70.00M | 71.00M | 63.00M | 59.00M | -20.32M | 12.65M | 4.11M | 2.89M | 854.00K |
| Cost & Expenses | 161.75M | 348.56M | 22.24M | 29.89M | -48.59M | 352.00M | 274.00M | 15.25M | 254.00M | 236.00M | 222.00M | 108.00M | 19.00M | 14.00M | 3.40M | 6.91M | 71.00M | 63.00M | 59.00M | -20.32M | 12.65M | 4.11M | 2.89M | 854.00K |
| Interest Income | 258.66M | 258.39M | 206.87M | 350.16M | 694.61M | 455.80M | 366.09M | 319.31M | 336.84M | 378.85M | 291.73M | 137.53M | 24.29M | 19.90M | 31.10M | 44.12M | 50.56M | 64.88M | 77.48M | 27.30M | 7.61M | 2.99M | 1.57M | 625.00K |
| Interest Expense | 192.13M | 129.42M | 83.25M | 223.07M | 566.75M | 377.07M | 308.10M | 254.67M | 260.65M | 301.01M | 231.18M | 105.93M | 4.84M | 9.61M | 14.24M | 36.26M | 50.09M | 60.10M | 60.10M | 16.01M | 3.27M | 1.67M | 1.29M | 476.00K |
| Depreciation & Amortization | 24.62M | 671.86M | 11.16M | 214.72M | 577.97M | 367.02M | 326.49M | 282.96M | 542.00K | -2.67M | 13.42M | 10.49M | 126.00K | 669.00K | 692.00K | 1.42M | 2.38M | 4.59M | 7.99M | 2.36M | 123.57K | 271.01K | 0.00 | 0.00 |
| EBITDA | 206.44M | 0.00 | 251.86M | 0.00 | 117.69M | 449.56M | 0.00 | 0.00 | 0.00 | 136.19M | 0.00 | 0.00 | 4.81M | 6.14M | 10.88M | -18.07M | 0.00 | 0.00 | 0.00 | 351.00 | 0.00 | 0.00 | 3.17M | 1.00M |
| EBITDA Ratio | 98.30% | -2,181.63% | 92.70% | 131.48% | 53.03% | 316.29% | 331.38% | 316.99% | 278.58% | 234.06% | 345.86% | 358.07% | 65.47% | 109.17% | 132.05% | -112.07% | 29.30% | 1,182.83% | 110.29% | 55.12% | 394.09% | 433.65% | 1,128.11% | 673.15% |
| Operating Income | 48.25M | -311.30M | 195.66M | -287.53M | 173.32M | 478.90M | 7.28M | 325.31M | 343.20M | 136.19M | 68.96M | 28.17M | 4.81M | 16.42M | 10.88M | -25.76M | -5.18M | 45.07M | 46.22M | 19.70M | 16.99M | 5.42M | 3.17M | 1.00M |
| Operating Income Ratio | 22.98% | -3,681.45% | 73.41% | 138.58% | 78.10% | 336.93% | 5.98% | 309.71% | 278.14% | 72.30% | 75.88% | 69.26% | 30.96% | 104.89% | 54.04% | 212.68% | 54.22% | 1,073.51% | 94.04% | 49.23% | 391.24% | 413.01% | 1,128.11% | 673.15% |
| Total Other Income/Expenses | -125.97M | -105.98M | -15.70M | -27.36M | 172.26M | 97.58M | 84.64M | 65.00K | 0.00 | 6.40M | 0.00 | 0.00 | -278.00K | -7.23M | -15.67M | 1.66M | -52.47M | 0.00 | -60.10M | -791.47K | 0.00 | -1.94M | 4.49M | 1.23M |
| Income Before Tax | -77.72M | -340.11M | 190.93M | -287.26M | 172.48M | 103.74M | 91.92M | 70.66M | 82.55M | 142.59M | 69.69M | 29.10M | 5.24M | 1.14M | 11.67M | -24.11M | 0.00 | 0.00 | -13.89M | 3.69M | 0.00 | 0.00 | 1.88M | 527.00K |
| Income Before Tax Ratio | -37.01% | -4,022.08% | 71.64% | 138.45% | 77.72% | 72.98% | 75.47% | 67.27% | 66.90% | 75.69% | 76.69% | 71.55% | 33.75% | 7.25% | 57.94% | 199.00% | 0.00% | 0.00% | -28.26% | 9.21% | 0.00% | 0.00% | 669.40% | 353.69% |
| Income Tax Expense | 75.00K | 542.00K | 2.46M | 981.00K | -419.00K | -1.06M | 3.36M | 3.10M | 4.54M | 6.40M | 739.00K | 932.00K | 433.00K | -5.67M | 15.02M | 37.92M | 50.09M | 60.10M | -8.55M | -1.26M | 3.27M | 1.67M | 0.00 | 0.00 |
| Net Income | -48.67M | -340.65M | 193.20M | -288.24M | 173.74M | 102.89M | 91.98M | 67.55M | 78.01M | 136.19M | 68.96M | 28.28M | 4.78M | 6.81M | 11.67M | -24.11M | -55.27M | -15.03M | -5.34M | 4.95M | 13.73M | 3.75M | 1.88M | 527.00K |
| Net Income Ratio | -23.17% | -4,028.49% | 72.49% | 138.93% | 78.29% | 72.39% | 75.52% | 64.31% | 63.22% | 72.30% | 75.88% | 69.53% | 30.74% | 43.48% | 57.94% | 199.00% | 578.36% | -358.05% | -10.87% | 12.36% | 316.04% | 285.60% | 669.40% | 353.69% |
| EPS | -0.99 | -3.61 | 2.03 | -3.11 | 3.14 | 2.79 | 2.72 | 2.00 | 2.48 | 5.92 | 4.44 | 4.32 | 1.84 | 2.88 | 5.00 | -11.66 | -121.87 | -166.64 | -11.95 | 56.00 | 30.23 | 84.29 | 42.28 | 11.84 |
| EPS Diluted | -0.99 | -3.61 | 2.03 | -3.11 | 2.86 | 2.79 | 2.64 | 2.00 | 2.48 | 5.92 | 4.44 | 4.32 | 1.84 | 2.88 | 4.76 | -11.66 | -121.87 | -166.64 | -11.95 | 56.00 | 30.23 | 84.29 | 42.28 | 11.84 |
| Weighted Avg Shares Out | 91.04M | 94.32M | 94.81M | 92.61M | 60.65M | 36.86M | 27.96M | 27.40M | 27.10M | 21.97M | 14.78M | 6.52M | 2.62M | 2.36M | 2.34M | 2.07M | 453.50K | 90.20K | 446.83K | 444.93K | 454.05K | 44.49K | 44.49K | 44.49K |
| Weighted Avg Shares Out (Dil) | 91.04M | 94.32M | 95.24M | 92.75M | 60.65M | 36.86M | 32.59M | 27.40M | 27.10M | 21.97M | 14.78M | 6.52M | 2.62M | 2.36M | 2.97M | 2.07M | 453.50K | 90.20K | 446.83K | 445.00K | 454.05K | 44.49K | 44.49K | 44.49K |

Preferreds Market Weekly Review

Inflation Running Hot: 3 Big Dividends To Beat It

Rates Go Higher, Preferreds Pull Back, Opportunities Arise

Buy Rated Preferreds (And Market Update)

Spooky Discount From New York Mortgage Preferred Share
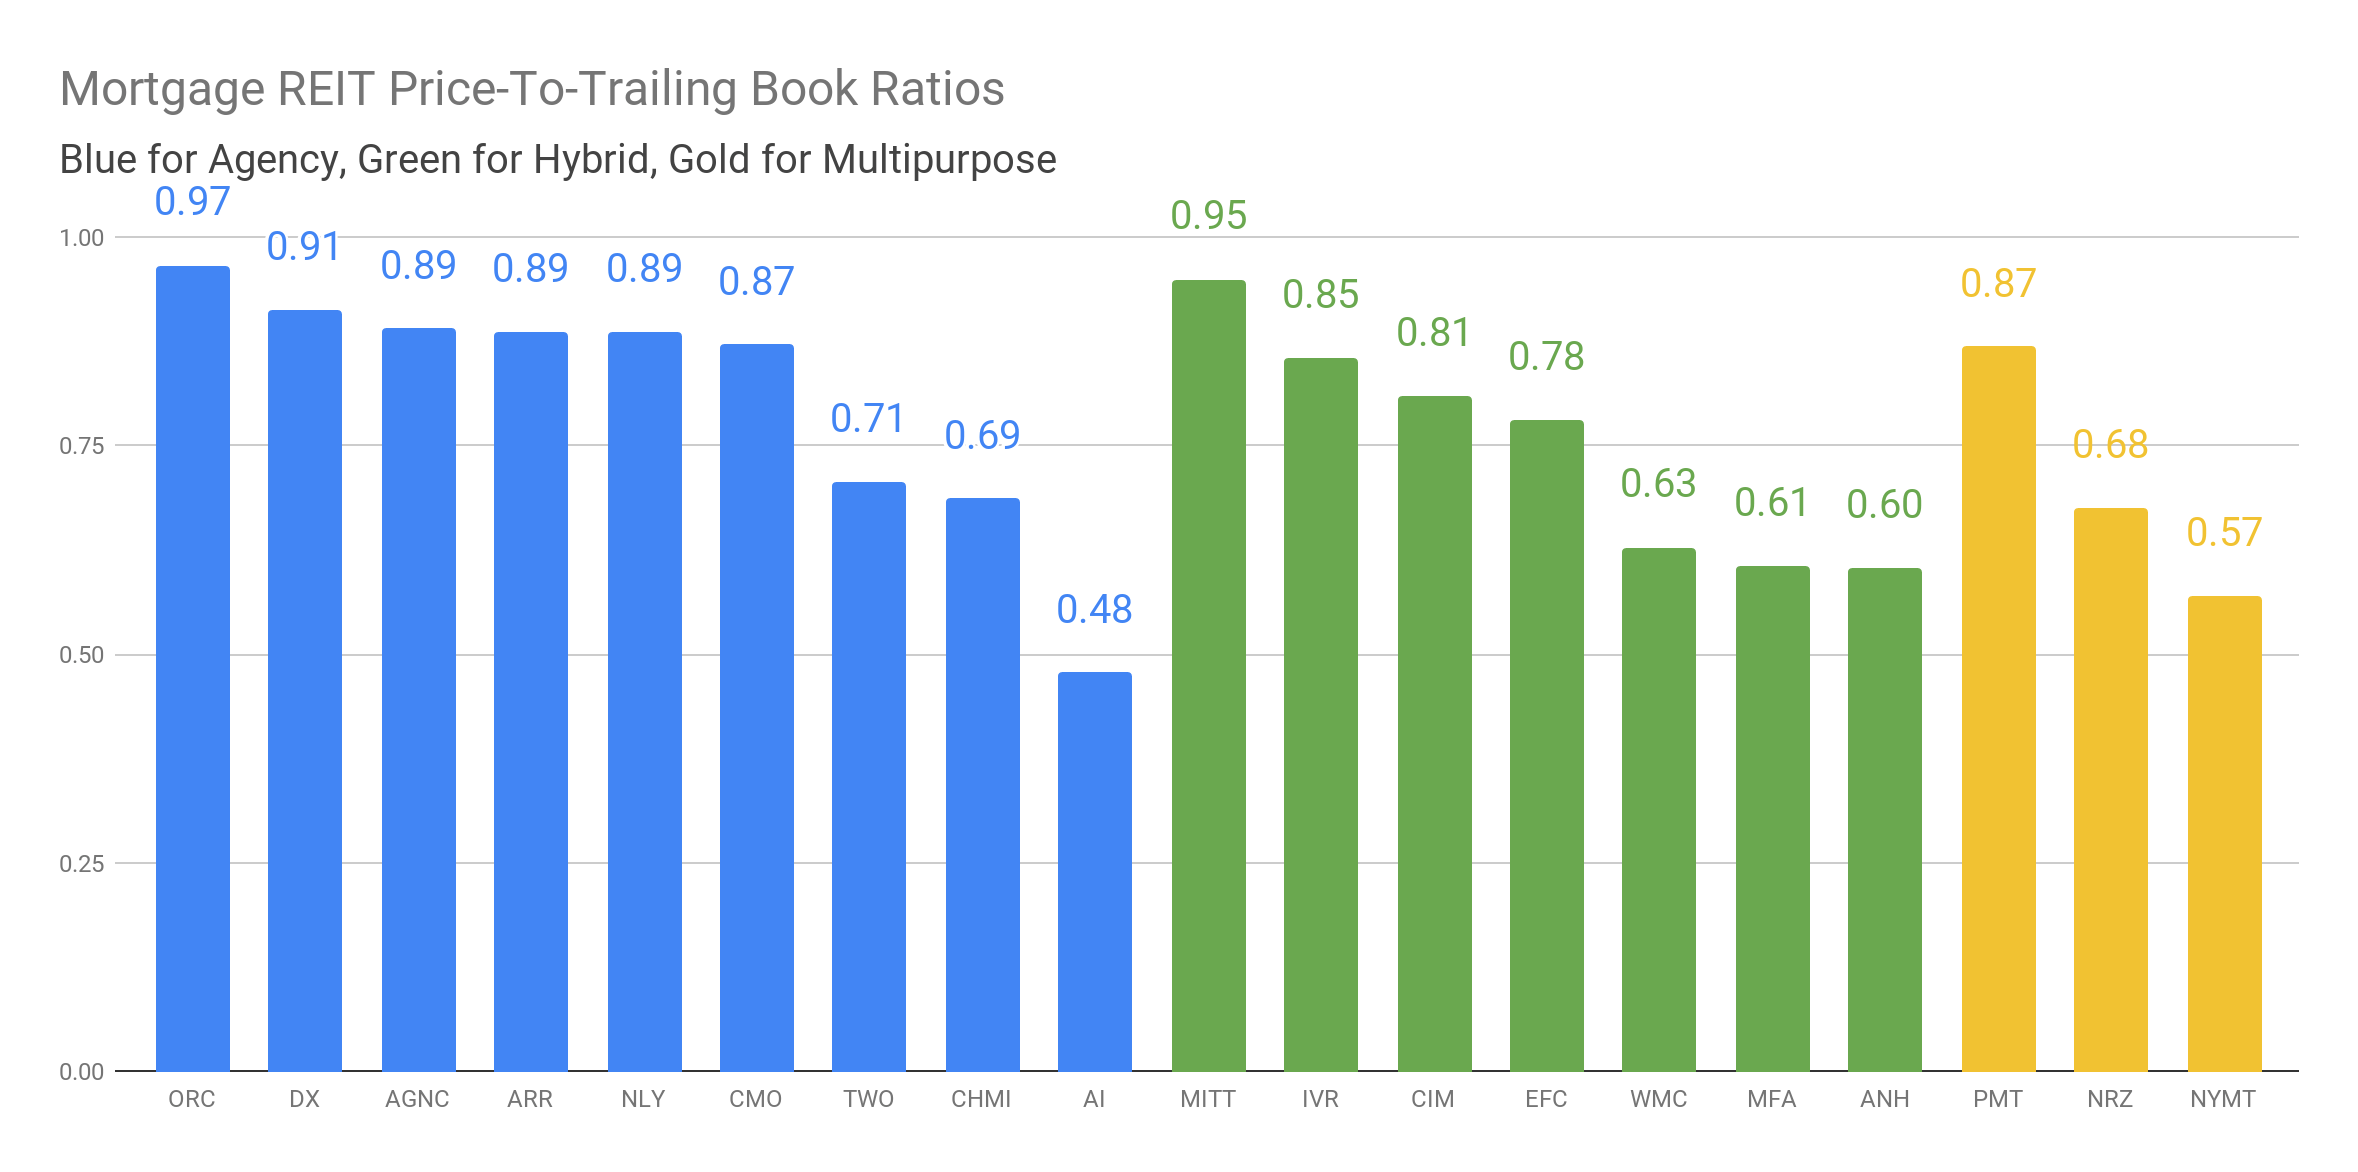
Plenty Of Upside From Discounts To NAV
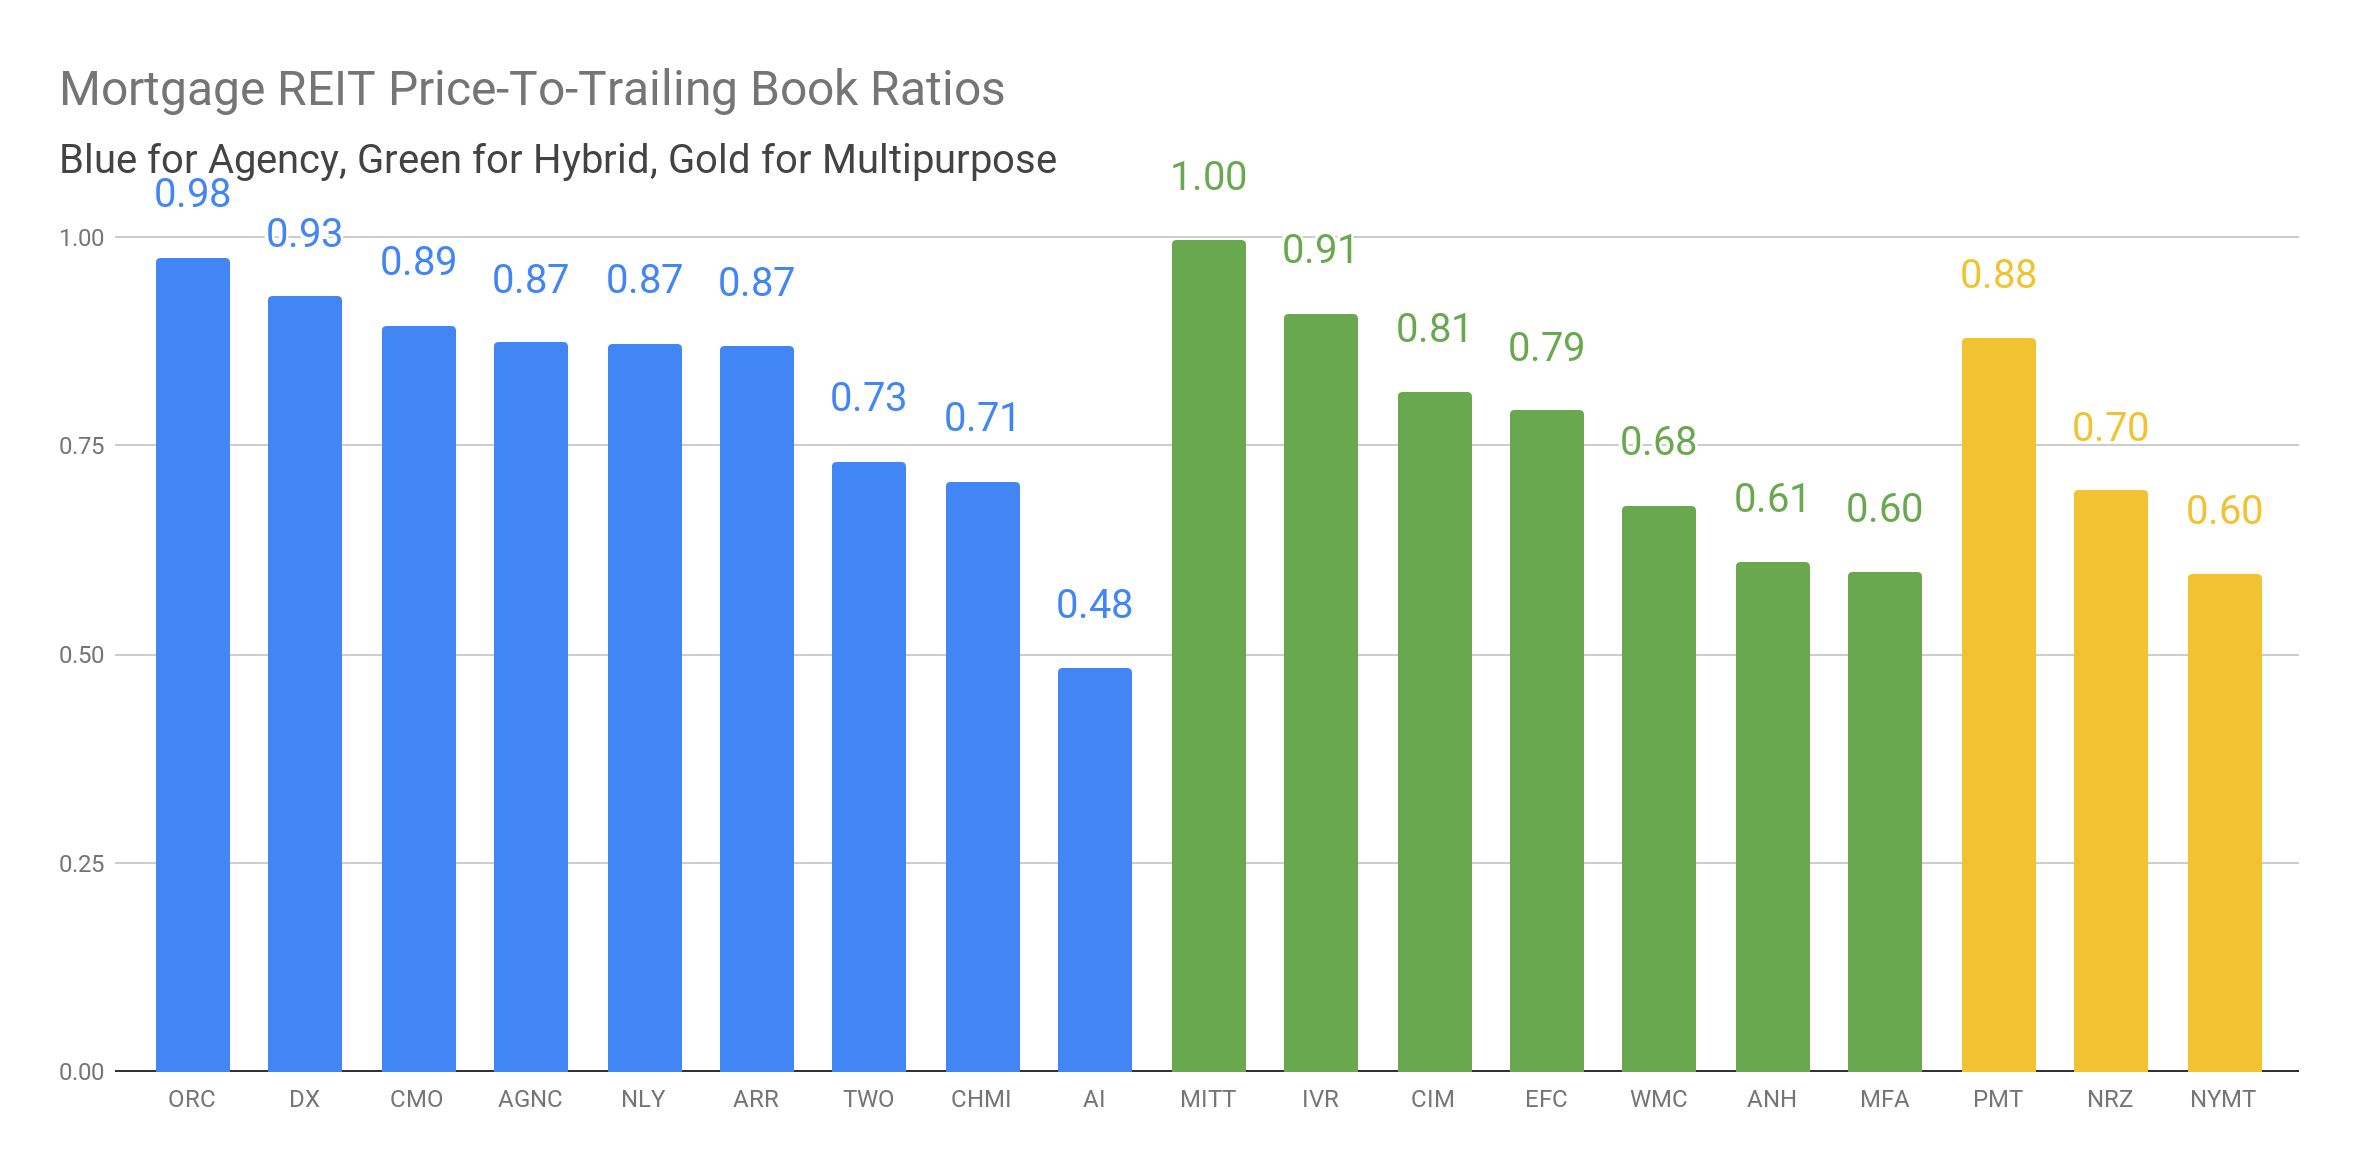
Upgrading One Of Our Least Favorite Mortgage REITs
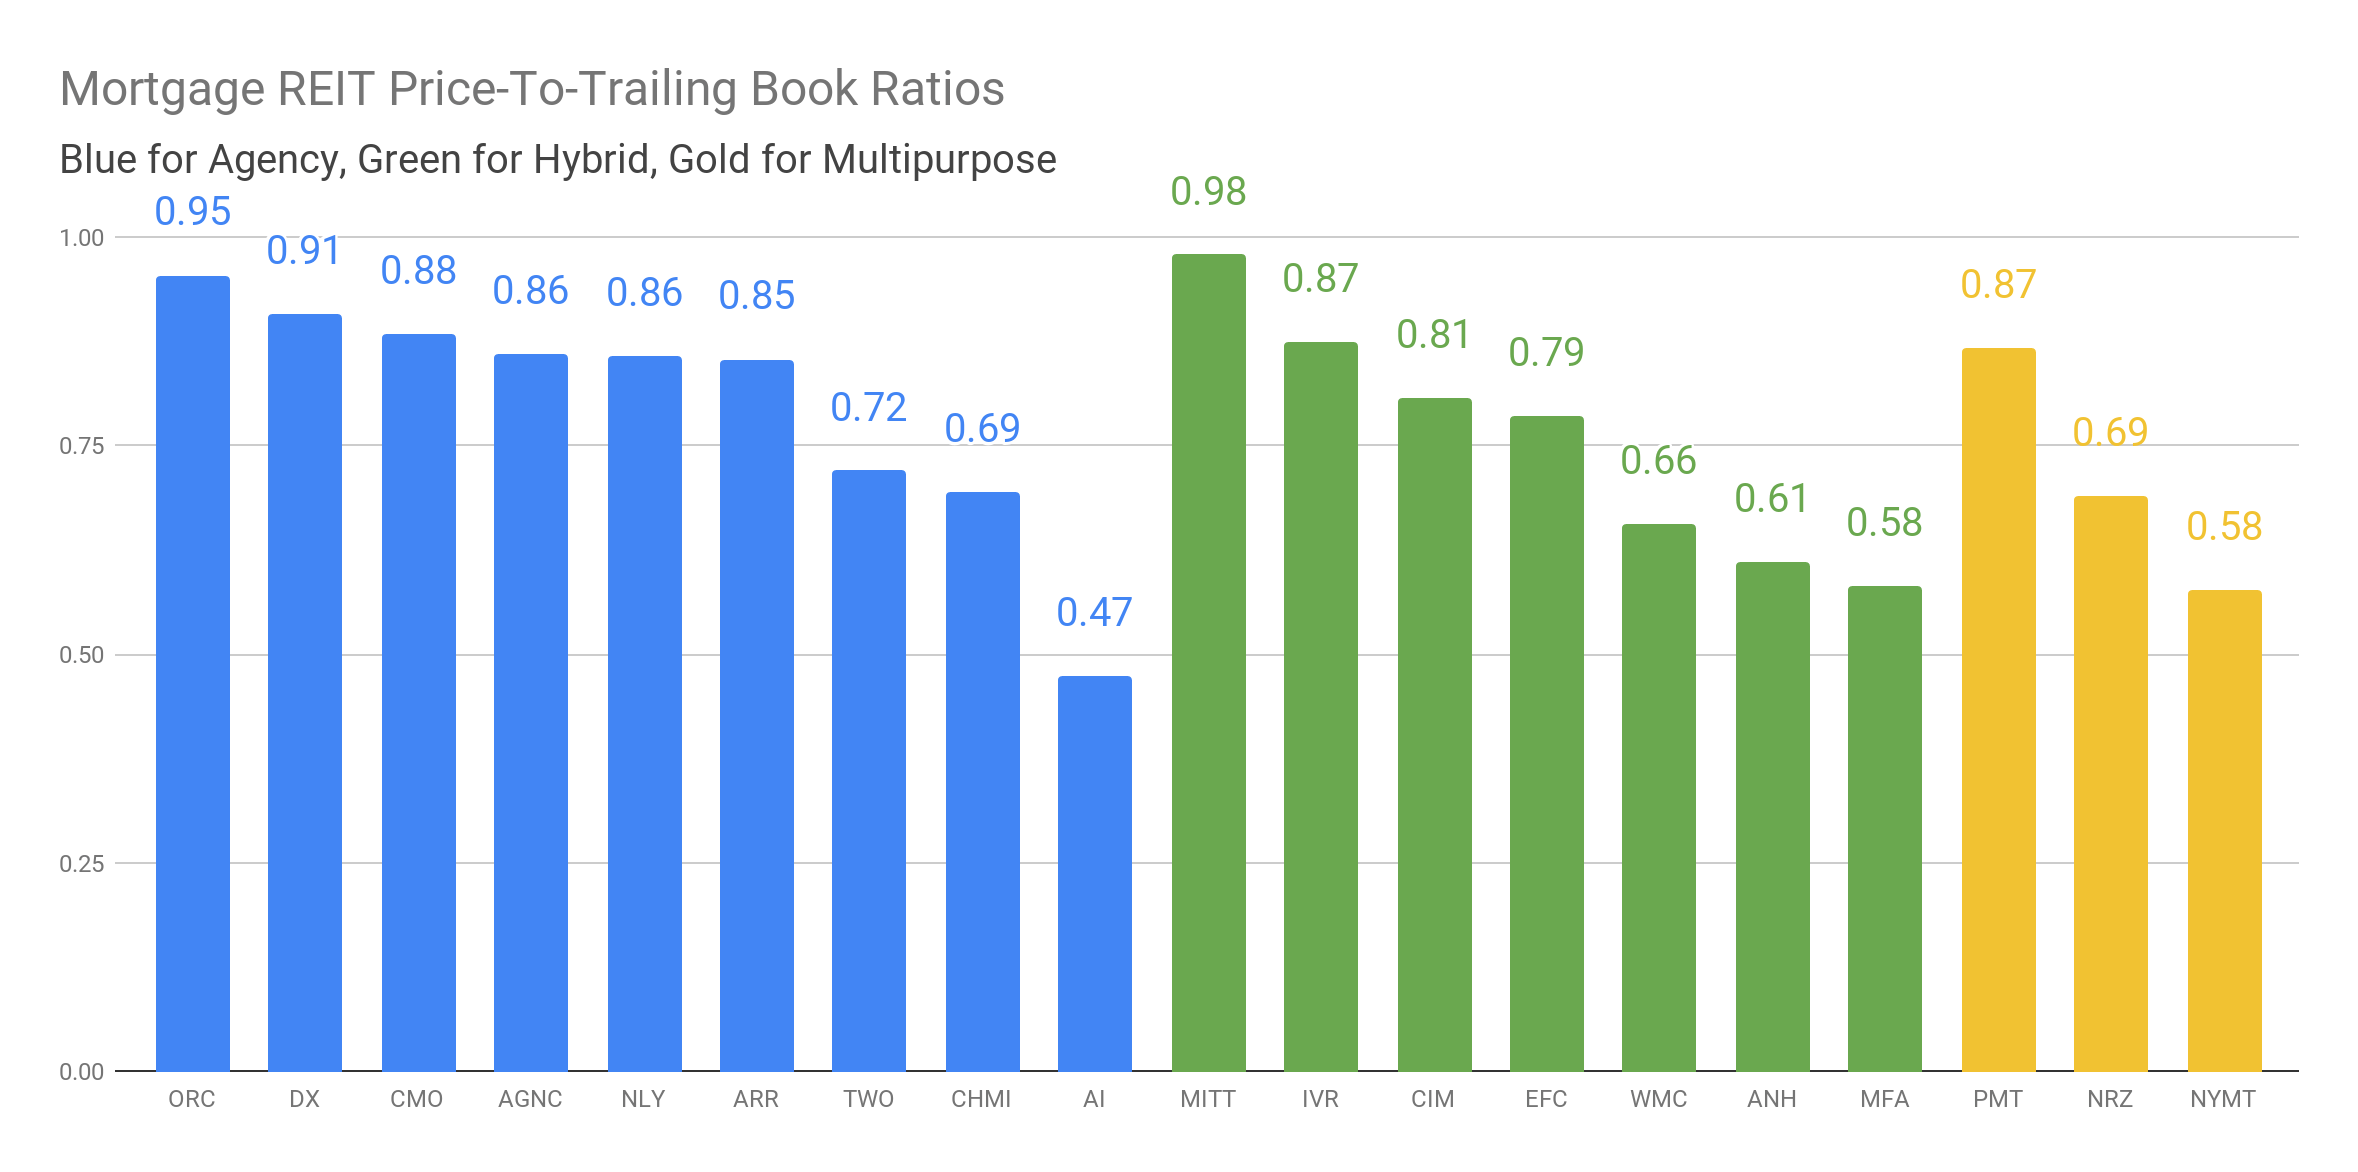
Sales Return For Mortgage REITs
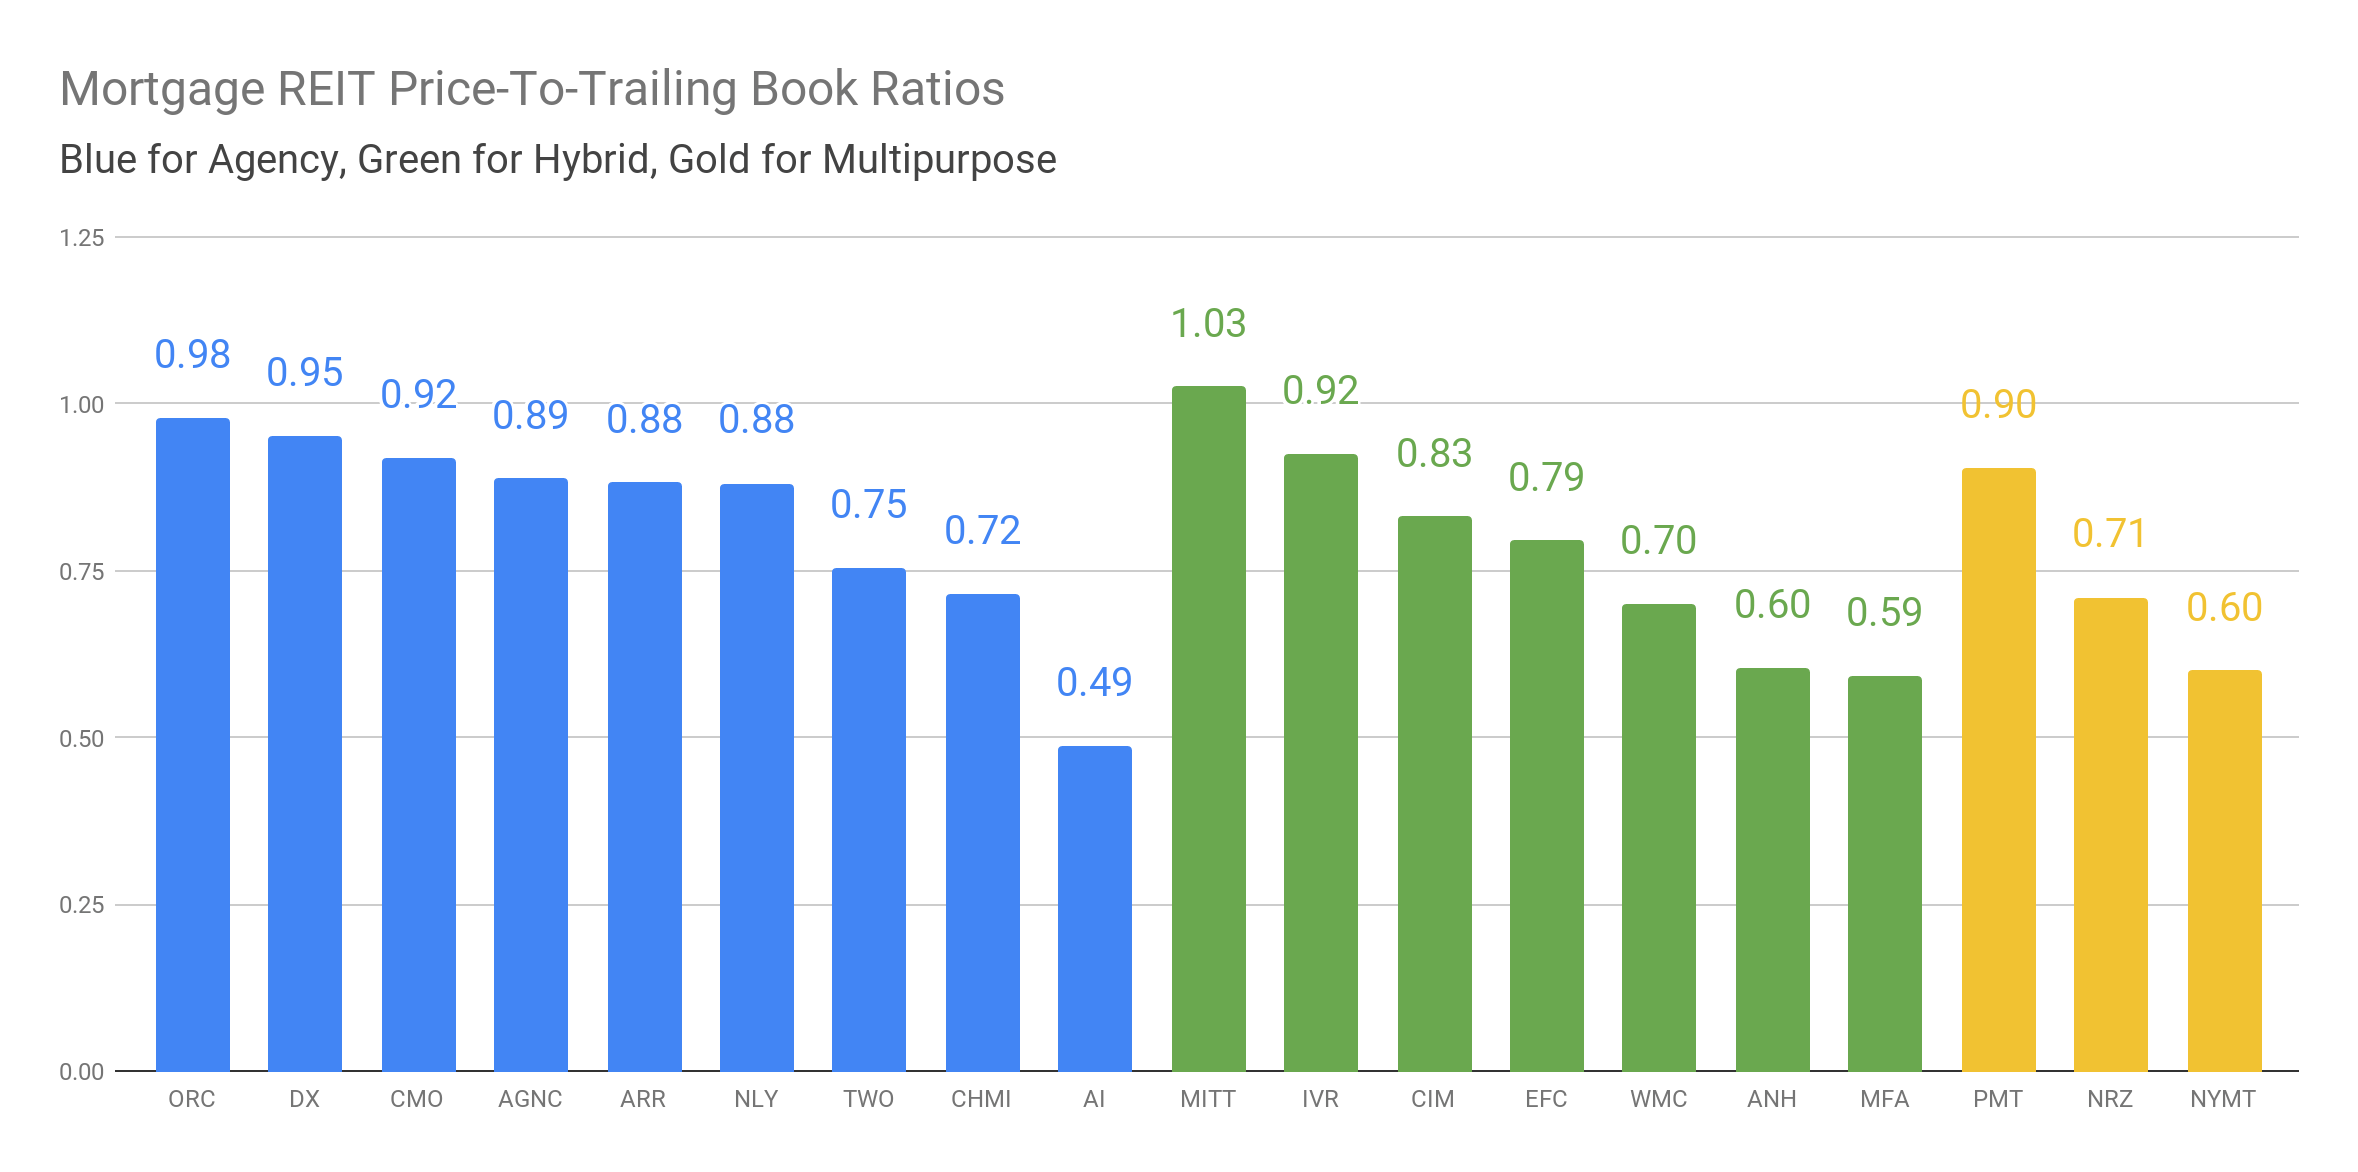
Quick And Dirty Discounts To Book Value For September 1st, 2020
An Introduction To Annaly
Source: https://incomestatements.info
Category: Stock Reports
