See more : PSG Group Ltd (PSG.JO) Income Statement Analysis – Financial Results
Complete financial analysis of Obsidian Energy Ltd. (OBE) income statement, including revenue, profit margins, EPS and key performance metrics. Get detailed insights into the financial performance of Obsidian Energy Ltd., a leading company in the Oil & Gas Exploration & Production industry within the Energy sector.
- Arena Fortify Acquisition Corp. (AFACW) Income Statement Analysis – Financial Results
- The Conygar Investment Company PLC (CIC.L) Income Statement Analysis – Financial Results
- Almunda Professionals N.V. (NOVI.AS) Income Statement Analysis – Financial Results
- Harmonic Inc. (0J38.L) Income Statement Analysis – Financial Results
- Bawan Company (1302.SR) Income Statement Analysis – Financial Results
Obsidian Energy Ltd. (OBE)
About Obsidian Energy Ltd.
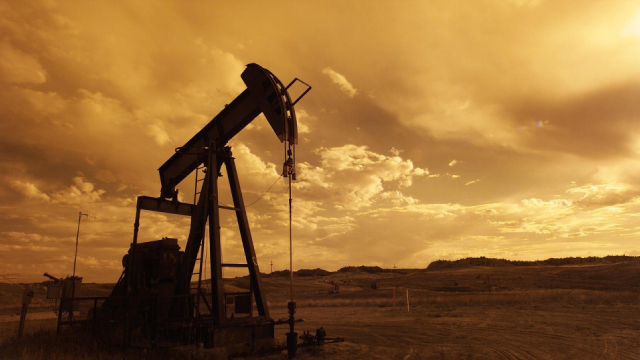
Obsidian Energy Ltd. primarily focuses on the exploration, production, and development of oil and natural gas properties in the Western Canada Sedimentary Basin. The company was formerly known as Penn West Petroleum Ltd. and changed its name to Obsidian Energy Ltd. in June 2017. Obsidian Energy Ltd. is headquartered in Calgary, Canada.
| Metric | 2023 | 2022 | 2021 | 2020 | 2019 | 2018 | 2017 | 2016 | 2015 | 2014 | 2013 | 2012 | 2011 | 2010 | 2009 | 2008 | 2007 | 2006 | 2005 | 2004 | 2003 | 2002 | 2001 |
|---|---|---|---|---|---|---|---|---|---|---|---|---|---|---|---|---|---|---|---|---|---|---|---|
| Revenue | 653.30M | 920.00M | 497.50M | 286.50M | 416.00M | 444.00M | 437.00M | 608.00M | 1.19B | 2.43B | 2.83B | 3.24B | 6.62B | 3.06B | 2.65B | 4.95B | 2.46B | 2.10B | 1.92B | 1.23B | 1.10B | 798.08M | 854.18M |
| Cost of Revenue | 322.80M | 224.30M | 100.00K | 1.04B | 1.08B | 605.00M | 529.00M | 959.00M | 3.09B | 2.49B | 3.15B | 3.14B | 1.73B | 1.54B | 1.51B | 1.80B | 992.60M | 824.10M | 350.10M | 0.00 | 0.00 | 0.00 | 0.00 |
| Gross Profit | 330.50M | 695.70M | 497.40M | -750.10M | -667.00M | -161.00M | -92.00M | -351.00M | -1.91B | -54.00M | -325.00M | 96.00M | 4.89B | 1.52B | 1.14B | 3.15B | 1.47B | 1.28B | 1.57B | 1.23B | 1.10B | 798.08M | 854.18M |
| Gross Profit Ratio | 50.59% | 75.62% | 99.98% | -261.82% | -160.34% | -36.26% | -21.05% | -57.73% | -160.49% | -2.22% | -11.50% | 2.97% | 73.92% | 49.59% | 43.07% | 63.67% | 59.63% | 60.77% | 81.76% | 100.00% | 100.00% | 100.00% | 100.00% |
| Research & Development | 0.00 | 0.00 | 0.00 | 0.00 | 0.00 | 0.00 | 0.00 | 0.00 | 0.00 | 0.00 | 0.00 | 0.00 | 0.00 | 0.00 | 0.00 | 0.00 | 0.00 | 0.00 | 0.00 | 0.00 | 0.00 | 0.00 | 0.00 |
| General & Administrative | 19.00M | 47.10M | 56.10M | 45.10M | 52.00M | 66.00M | 68.00M | 103.00M | 144.00M | 188.00M | 221.00M | 191.00M | 226.00M | 0.00 | 0.00 | 0.00 | 0.00 | 0.00 | 0.00 | 0.00 | 0.00 | 0.00 | 0.00 |
| Selling & Marketing | 16.20M | 0.00 | 0.00 | 0.00 | 0.00 | 0.00 | 0.00 | 0.00 | 0.00 | 0.00 | 0.00 | 0.00 | 0.00 | 0.00 | 0.00 | 0.00 | 0.00 | 0.00 | 0.00 | 0.00 | 0.00 | 0.00 | 0.00 |
| SG&A | 35.20M | 47.10M | 56.10M | 45.10M | 52.00M | 66.00M | 68.00M | 103.00M | 144.00M | 188.00M | 221.00M | 191.00M | 226.00M | 181.00M | 168.00M | 157.84M | 65.80M | 47.30M | 100.30M | 16.09M | 12.50M | 10.32M | 7.42M |
| Other Expenses | 0.00 | 30.70M | -9.80M | -24.80M | -11.00M | -16.00M | -15.00M | -82.00M | 296.00M | 52.00M | 87.00M | 71.00M | 1.16B | 1.25B | 1.33B | 1.59B | 896.70M | 669.40M | 452.30M | 782.69M | 532.72M | 474.11M | 374.34M |
| Operating Expenses | 428.30M | 77.80M | 46.30M | 20.30M | 41.00M | 60.00M | 60.00M | 372.00M | 440.00M | 240.00M | 308.00M | 262.00M | 1.29B | 1.52B | 1.50B | 1.75B | 962.50M | 716.70M | 552.60M | 798.78M | 545.22M | 484.43M | 381.76M |
| Cost & Expenses | 279.10M | 302.10M | 46.40M | 1.06B | 1.12B | 665.00M | 589.00M | 1.33B | 3.53B | 2.73B | 3.46B | 3.40B | 3.01B | 3.06B | 3.01B | 3.55B | 1.96B | 1.54B | 902.70M | 798.78M | 545.22M | 484.43M | 381.76M |
| Interest Income | 500.00K | 6.90M | 6.00M | 13.00M | 8.50M | 0.00 | 0.00 | 0.00 | 0.00 | 0.00 | 0.00 | 0.00 | 0.00 | 0.00 | 0.00 | 0.00 | 0.00 | 0.00 | 0.00 | 0.00 | 0.00 | 0.00 | 0.00 |
| Interest Expense | 31.80M | 31.00M | 27.90M | 24.30M | 40.00M | 21.00M | 23.00M | 114.00M | 162.00M | 158.00M | 184.00M | 199.00M | 190.00M | 174.00M | 161.00M | 204.00M | 0.00 | 49.30M | 23.20M | 0.00 | 11.87M | 0.00 | 0.00 |
| Depreciation & Amortization | 211.00M | 185.70M | 125.70M | 134.20M | 254.20M | 298.00M | 300.00M | 392.00M | 2.37B | 1.38B | 1.79B | 1.53B | 1.16B | 1.34B | 1.56B | 1.59B | 896.70M | 654.70M | 437.60M | 413.07M | 322.03M | 258.70M | 201.32M |
| EBITDA | 383.60M | 620.50M | 459.30M | 155.50M | 160.50M | 127.00M | 249.00M | -154.00M | -736.00M | 1.09B | 835.00M | 1.36B | 1.76B | 1.34B | 1.20B | 3.15B | 1.40B | 1.21B | 1.45B | 839.50M | 879.50M | 572.34M | 673.74M |
| EBITDA Ratio | 58.72% | 67.45% | 92.32% | 47.64% | 43.75% | 39.19% | 35.70% | -24.51% | 1.85% | 44.80% | 41.00% | 42.01% | 26.58% | 43.74% | 45.11% | 57.22% | 63.48% | 55.51% | 94.67% | 68.52% | 79.76% | 71.71% | 78.88% |
| Operating Income | 374.20M | 732.00M | 649.90M | -766.40M | -731.00M | -221.00M | -152.00M | -723.00M | -2.35B | -294.00M | 714.00M | -166.00M | 542.00M | 81.00M | -361.00M | 1.40B | 503.70M | 560.10M | 1.02B | 426.43M | 557.47M | 313.64M | 472.42M |
| Operating Income Ratio | 57.28% | 79.57% | 130.63% | -267.50% | -175.72% | -49.77% | -34.78% | -118.91% | -197.56% | -12.08% | 25.26% | -5.13% | 8.19% | 2.65% | -13.63% | 28.25% | 20.49% | 26.66% | 52.96% | 34.80% | 50.56% | 39.30% | 55.31% |
| Total Other Income/Expenses | -230.60M | -54.80M | -39.30M | -889.50M | -68.60M | -84.00M | 55.00M | -225.00M | -920.00M | -1.56B | -2.22B | 385.00M | -86.00M | 951.00M | -161.00M | -41.52M | -252.80M | 14.22M | -371.40M | -17.00M | -11.87M | -20.31M | -26.71M |
| Income Before Tax | 143.60M | 563.70M | 414.00M | -771.70M | -788.00M | -305.00M | -97.00M | -948.00M | -3.27B | -1.85B | -1.08B | 237.00M | 411.00M | -93.00M | -522.00M | 1.36B | 250.90M | 574.10M | 644.90M | 409.41M | 545.60M | 293.33M | 445.71M |
| Income Before Tax Ratio | 21.98% | 61.27% | 83.22% | -269.35% | -189.42% | -68.69% | -22.20% | -155.92% | -275.06% | -76.08% | -38.24% | 7.33% | 6.21% | -3.04% | -19.71% | 27.42% | 10.20% | 27.33% | 33.61% | 33.42% | 49.48% | 36.75% | 52.18% |
| Income Tax Expense | 35.60M | -246.40M | 232.20M | 31.10M | 17.00M | -63.00M | -13.00M | -252.00M | -619.00M | -118.00M | -243.00M | 63.00M | -227.00M | -319.00M | -378.00M | 134.77M | 75.40M | -106.20M | 53.00M | 137.55M | 110.65M | 134.89M | 200.61M |
| Net Income | 108.00M | 810.10M | 181.80M | -802.80M | -805.00M | -305.00M | -84.00M | -696.00M | -2.65B | -1.73B | -838.00M | 174.00M | 638.00M | 226.00M | -144.00M | 1.22B | 175.50M | 665.60M | 577.20M | 271.87M | 434.95M | 158.44M | 245.10M |
| Net Income Ratio | 16.53% | 88.05% | 36.54% | -280.21% | -193.51% | -68.69% | -19.22% | -114.47% | -222.91% | -71.23% | -29.64% | 5.38% | 9.64% | 7.39% | -5.44% | 24.69% | 7.14% | 31.68% | 30.08% | 22.19% | 39.44% | 19.85% | 28.69% |
| EPS | 1.28 | 9.88 | 2.42 | -10.95 | -11.04 | -4.22 | -1.19 | -9.70 | -36.90 | -24.57 | -12.11 | 2.59 | 9.59 | 17.57 | -2.44 | 22.75 | 5.11 | 23.24 | 24.85 | 11.76 | 58.10 | 20.86 | 32.83 |
| EPS Diluted | 1.28 | 9.60 | 2.34 | -10.95 | -11.04 | -4.22 | -1.17 | -9.70 | -36.90 | -24.57 | -12.07 | 2.59 | 9.52 | 17.36 | -2.44 | 22.54 | 5.11 | 22.89 | 24.36 | 11.55 | 57.33 | 20.30 | 31.78 |
| Weighted Avg Shares Out | 84.38M | 82.00M | 75.10M | 73.30M | 72.90M | 72.33M | 70.59M | 71.76M | 71.71M | 70.52M | 69.20M | 67.94M | 66.74M | 63.11M | 58.99M | 53.66M | 34.20M | 28.69M | 23.23M | 7.70M | 7.69M | 7.60M | 7.47M |
| Weighted Avg Shares Out (Dil) | 84.10M | 84.40M | 77.60M | 73.30M | 72.90M | 72.33M | 71.99M | 71.76M | 71.71M | 70.53M | 69.40M | 67.97M | 66.77M | 64.51M | 58.99M | 54.70M | 34.50M | 29.07M | 23.69M | 7.70M | 7.79M | 7.80M | 7.71M |
Why Small-Cap Natural Gas Stocks Were Soaring Today
Obsidian Energy: Addresses Near-Term Debt Maturities

Olympic diver Tom Daley receives his OBE at Windsor Castle

Obsidian Energy: An Attractive Play On High Oil And Gas Prices

Obsidian Energy And Baytex Energy: 2 Canadian Oil And Gas Stocks That Could Double From Here
Obsidian Energy: Increased Production Volumes From Heavy Oil And Viking Wells
Obsidian Energy: 300% Upside; The Best Stock For Oil Bulls

4 Cheap Stocks That Wall Street Analysts Love

Obsidian Energy Announces Release Date of First Quarter 2022 Results
Obsidian Energy: Substantially Undervalued And Poised For Strong Growth
Source: https://incomestatements.info
Category: Stock Reports
