See more : PT Nusatama Berkah Tbk (NTBK.JK) Income Statement Analysis – Financial Results
Complete financial analysis of Obsidian Energy Ltd. (OBELF) income statement, including revenue, profit margins, EPS and key performance metrics. Get detailed insights into the financial performance of Obsidian Energy Ltd., a leading company in the Oil & Gas Exploration & Production industry within the Energy sector.
- Weyco Group, Inc. (WEYS) Income Statement Analysis – Financial Results
- Farmers Edge Inc. (FMEGF) Income Statement Analysis – Financial Results
- ScoutCam Inc. (SCTC) Income Statement Analysis – Financial Results
- First International Bank of Israel Ltd (FBKIF) Income Statement Analysis – Financial Results
- China Harzone Industry Corp., Ltd (300527.SZ) Income Statement Analysis – Financial Results
Obsidian Energy Ltd. (OBELF)
About Obsidian Energy Ltd.
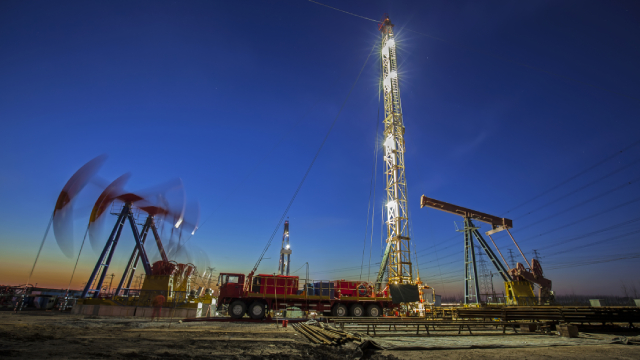
Obsidian Energy Ltd. primarily focuses on the exploration, production, and development of oil and natural gas properties in the Western Canada Sedimentary Basin. The company was formerly known as Penn West Petroleum Ltd. and changed its name to Obsidian Energy Ltd. in June 2017. Obsidian Energy Ltd. is headquartered in Calgary, Canada.
| Metric | 2023 | 2022 | 2021 | 2020 | 2019 | 2018 | 2017 | 2016 | 2015 | 2014 | 2013 | 2012 | 2011 | 2010 | 2009 | 2008 | 2007 | 2006 | 2005 | 2004 | 2003 | 2002 | 2001 |
|---|---|---|---|---|---|---|---|---|---|---|---|---|---|---|---|---|---|---|---|---|---|---|---|
| Revenue | 653.30M | 771.70M | 448.90M | 272.80M | 389.30M | 408.00M | 420.00M | 586.00M | 1.06B | 2.06B | 2.45B | 3.24B | 3.67B | 3.06B | 2.65B | 4.95B | 2.46B | 2.10B | 1.92B | 1.23B | 1.10B | 798.08M | 854.18M |
| Cost of Revenue | 243.90M | 222.60M | 160.80M | 137.70M | 175.80M | 194.00M | 218.00M | 316.00M | 643.00M | 774.00M | 1.08B | 3.14B | 1.73B | 1.54B | 1.51B | 1.80B | 992.60M | 824.10M | 350.10M | 0.00 | 0.00 | 0.00 | 0.00 |
| Gross Profit | 409.40M | 549.10M | 288.10M | 135.10M | 213.50M | 214.00M | 202.00M | 270.00M | 416.00M | 1.29B | 1.37B | 96.00M | 1.94B | 1.52B | 1.14B | 3.15B | 1.47B | 1.28B | 1.57B | 1.23B | 1.10B | 798.08M | 854.18M |
| Gross Profit Ratio | 62.67% | 71.15% | 64.18% | 49.52% | 54.84% | 52.45% | 48.10% | 46.08% | 39.28% | 62.41% | 55.90% | 2.97% | 52.93% | 49.59% | 43.07% | 63.67% | 59.63% | 60.77% | 81.76% | 100.00% | 100.00% | 100.00% | 100.00% |
| Research & Development | 0.00 | 0.00 | 0.00 | 0.00 | 0.00 | 0.00 | 0.00 | 0.00 | 0.00 | 0.00 | 0.00 | 0.00 | 0.00 | 0.00 | 0.00 | 0.00 | 0.00 | 0.00 | 0.00 | 0.00 | 0.00 | 0.00 | 0.00 |
| General & Administrative | 19.00M | 18.40M | 15.30M | 13.90M | 20.00M | 24.00M | 31.00M | 56.00M | 92.00M | 131.00M | 160.00M | 191.00M | 241.00M | 0.00 | 0.00 | 0.00 | 0.00 | 0.00 | 0.00 | 0.00 | 0.00 | 0.00 | 0.00 |
| Selling & Marketing | 16.20M | 28.10M | 19.40M | 3.40M | 4.60M | 6.00M | 8.00M | 254.00M | 6.00M | 12.00M | 32.00M | 0.00 | 0.00 | 0.00 | 0.00 | 0.00 | 0.00 | 0.00 | 0.00 | 0.00 | 0.00 | 0.00 | 0.00 |
| SG&A | 35.20M | 46.50M | 34.70M | 17.30M | 24.60M | 30.00M | 39.00M | 310.00M | 98.00M | 143.00M | 192.00M | 191.00M | 241.00M | 0.00 | 0.00 | 0.00 | 0.00 | 0.00 | 0.00 | 0.00 | 0.00 | 0.00 | 0.00 |
| Other Expenses | 0.00 | 0.00 | -9.80M | -22.60M | -11.00M | -6.00M | -8.00M | 269.00M | 296.00M | 52.00M | 87.00M | 71.00M | 1.16B | 1.44B | 1.50B | 1.75B | 962.50M | 716.70M | 552.60M | 798.78M | 545.22M | 484.43M | 381.76M |
| Operating Expenses | 235.40M | 47.00M | 159.30M | 881.20M | 972.80M | 498.00M | 276.00M | 1.10B | 3.52B | 2.98B | 2.23B | 262.00M | 1.40B | 1.44B | 1.50B | 1.75B | 962.50M | 716.70M | 552.60M | 798.78M | 545.22M | 484.43M | 381.76M |
| Cost & Expenses | 479.30M | 269.60M | 320.10M | 1.02B | 1.15B | 692.00M | 494.00M | 1.42B | 4.16B | 3.75B | 3.31B | 3.40B | 3.13B | 2.98B | 3.01B | 3.55B | 1.96B | 1.54B | 902.70M | 798.78M | 545.22M | 484.43M | 381.76M |
| Interest Income | 30.40M | 31.80M | 33.40M | 25.60M | 29.00M | 0.00 | 0.00 | 0.00 | 0.00 | 0.00 | 0.00 | 0.00 | 0.00 | 0.00 | 0.00 | 0.00 | 0.00 | 0.00 | 0.00 | 0.00 | 0.00 | 0.00 | 0.00 |
| Interest Expense | 0.00 | 0.00 | 27.90M | 24.30M | 40.00M | 21.00M | 23.00M | 114.00M | 162.00M | 158.00M | 184.00M | 199.00M | 190.00M | 174.00M | 161.00M | 0.00 | 0.00 | 49.30M | 23.20M | 0.00 | 11.87M | 0.00 | 0.00 |
| Depreciation & Amortization | 228.50M | -99.90M | -190.60M | 902.90M | 913.00M | 411.00M | 323.00M | 656.00M | 2.32B | 1.22B | 1.78B | 1.53B | 1.20B | 1.34B | 1.56B | 1.59B | 896.70M | 654.70M | 437.60M | 413.07M | 322.03M | 258.70M | 201.32M |
| EBITDA | 401.40M | 831.57M | 537.87M | 168.50M | 179.50M | 162.00M | 179.00M | 228.00M | 418.00M | 1.15B | 1.10B | 1.96B | 1.80B | 1.42B | 1.20B | 2.95B | 1.15B | 1.26B | 1.09B | 822.49M | 879.50M | 552.03M | 647.03M |
| EBITDA Ratio | 61.44% | 107.76% | 119.82% | 61.77% | 46.11% | 39.71% | 42.62% | 38.91% | 39.47% | 55.80% | 44.92% | 60.62% | 49.20% | 46.42% | 45.11% | 59.65% | 46.67% | 60.14% | 56.85% | 67.13% | 79.76% | 69.17% | 75.75% |
| Operating Income | 176.30M | 602.10M | 453.20M | 37.20M | -722.60M | -243.00M | -133.00M | -634.00M | -1.91B | -66.00M | -680.00M | -166.00M | 542.00M | 81.00M | -361.00M | 1.40B | 503.70M | 560.10M | 1.02B | 426.43M | 557.47M | 313.64M | 472.42M |
| Operating Income Ratio | 26.99% | 78.02% | 100.96% | 13.64% | -185.62% | -59.56% | -31.67% | -108.19% | -179.89% | -3.21% | -27.77% | -5.13% | 14.78% | 2.65% | -13.63% | 28.25% | 20.49% | 26.66% | 52.96% | 34.80% | 50.56% | 39.30% | 55.31% |
| Total Other Income/Expenses | -32.70M | -38.40M | -39.20M | -808.90M | -65.70M | -62.00M | 36.00M | -314.00M | -1.36B | -1.79B | -362.00M | 403.00M | -131.00M | -174.00M | -161.00M | -41.28M | -252.80M | 14.00M | -371.40M | -17.01M | -11.87M | -20.31M | -26.71M |
| Income Before Tax | 143.60M | 563.70M | 414.00M | -771.70M | -788.30M | -305.00M | -97.00M | -948.00M | -3.27B | -1.85B | -1.04B | 237.00M | 411.00M | -93.00M | -522.00M | 1.36B | 250.90M | 574.10M | 644.90M | 409.41M | 545.60M | 293.33M | 445.71M |
| Income Before Tax Ratio | 21.98% | 73.05% | 92.23% | -282.88% | -202.49% | -74.75% | -23.10% | -161.77% | -308.31% | -89.90% | -42.55% | 7.33% | 11.21% | -3.04% | -19.71% | 27.42% | 10.20% | 27.33% | 33.61% | 33.42% | 49.48% | 36.75% | 52.18% |
| Income Tax Expense | 35.60M | 246.40M | 27.90M | 18.60M | -40.00M | -63.00M | 13.00M | 252.00M | 619.00M | 118.00M | 233.00M | 63.00M | -227.00M | -319.00M | -378.00M | 134.77M | 75.40M | -106.20M | 53.00M | 137.55M | 110.65M | 134.89M | 200.61M |
| Net Income | 108.00M | 810.10M | 414.00M | -771.70M | -788.30M | -305.00M | -84.00M | -696.00M | -2.65B | -1.73B | -809.00M | 174.00M | 638.00M | 226.00M | -144.00M | 1.22B | 175.50M | 665.60M | 577.20M | 271.87M | 434.95M | 158.44M | 245.10M |
| Net Income Ratio | 16.53% | 104.98% | 92.23% | -282.88% | -202.49% | -74.75% | -20.00% | -118.77% | -249.86% | -84.17% | -33.03% | 5.38% | 17.40% | 7.39% | -5.44% | 24.69% | 7.14% | 31.68% | 30.08% | 22.19% | 39.44% | 19.85% | 28.69% |
| EPS | 1.28 | 9.60 | 5.34 | -10.53 | -10.82 | -4.22 | -1.19 | -9.73 | -36.90 | -24.57 | -11.69 | 2.56 | 9.56 | 3.58 | -2.44 | 22.76 | 5.13 | 23.24 | 24.85 | 35.35 | 56.63 | 20.86 | 32.83 |
| EPS Diluted | 1.28 | 9.60 | 5.34 | -10.53 | -10.81 | -4.22 | -1.17 | -9.70 | -36.90 | -24.57 | -11.66 | 2.56 | 9.55 | 3.53 | -2.44 | 22.33 | 5.09 | 22.89 | 24.36 | 34.72 | 55.86 | 20.30 | 31.78 |
| Weighted Avg Shares Out | 84.38M | 84.39M | 77.53M | 73.29M | 72.86M | 72.27M | 70.59M | 71.53M | 71.71M | 70.52M | 69.20M | 67.94M | 66.74M | 63.11M | 58.99M | 53.66M | 34.20M | 28.64M | 23.23M | 7.69M | 7.68M | 7.60M | 7.47M |
| Weighted Avg Shares Out (Dil) | 84.10M | 84.40M | 77.60M | 73.30M | 72.90M | 72.30M | 71.99M | 71.76M | 71.71M | 70.52M | 69.40M | 67.97M | 66.77M | 63.94M | 58.99M | 54.70M | 34.50M | 29.08M | 23.69M | 7.83M | 7.79M | 7.80M | 7.71M |

Comparing InPlay Oil With Cardinal Energy, And Obsidian Energy

5 'Magic Formula' Energy Stocks to Consider as Oil Prices Rise

Obsidian Energy: It Is Those Debt Levels

Obsidian Energy Announces Application for Listing on the NYSE American and 2022 Guidance Release Webcast

Obsidian Energy: Net Debt May Be Reduced To $200 Million By End Of 2022

Obsidian Energy Provides Operational Update

Obsidian Energy Announces Increased 2021 Production and Capital Expenditure Guidance with Second Quarter 2021 Results

Obsidian's Outlook Is Benefiting From Higher Commodity Prices

Obsidian Energy Announces Voting Results from the 2021 Annual and Special Meeting of Shareholders

Obsidian Energy Announces Change to Board of Directors
Source: https://incomestatements.info
Category: Stock Reports
