See more : PT Capri Nusa Satu Properti Tbk (CPRI.JK) Income Statement Analysis – Financial Results
Complete financial analysis of Ocado Group plc (OCDGF) income statement, including revenue, profit margins, EPS and key performance metrics. Get detailed insights into the financial performance of Ocado Group plc, a leading company in the Grocery Stores industry within the Consumer Defensive sector.
- Banco do Estado de Sergipe S.A. (BGIP4.SA) Income Statement Analysis – Financial Results
- Federal National Mortgage Association (FNMAI) Income Statement Analysis – Financial Results
- Leoch International Technology Limited (LCHIF) Income Statement Analysis – Financial Results
- Niraj Ispat Industries Limited (NIRAJISPAT.NS) Income Statement Analysis – Financial Results
- EPS Creative Health Technology Group Limited (3860.HK) Income Statement Analysis – Financial Results
Ocado Group plc (OCDGF)
About Ocado Group plc
Ocado Group plc operates as an online grocery retailer in the United Kingdom and internationally. The company operates through three segments: Ocado Retail, UK Solutions & Logistics, and International Solutions. It also sells general merchandise products on its Ocado.com; provides online retail solutions; and offers customer fulfillment centre and logistics services. The company was founded in 2000 and is headquartered in Hatfield, the United Kingdom.
| Metric | 2023 | 2022 | 2021 | 2020 | 2019 | 2018 | 2017 | 2016 | 2015 | 2014 | 2013 | 2012 | 2011 | 2010 | 2009 | 2008 | 2007 |
|---|---|---|---|---|---|---|---|---|---|---|---|---|---|---|---|---|---|
| Revenue | 2.83B | 2.51B | 2.50B | 2.33B | 1.76B | 1.60B | 1.46B | 1.27B | 1.11B | 948.90M | 792.10M | 678.60M | 598.31M | 515.69M | 402.00M | 321.31M | 272.86M |
| Cost of Revenue | 2.76B | 1.55B | 1.57B | 1.52B | 1.16B | 1.05B | 959.50M | 835.70M | 732.50M | 636.00M | 544.60M | 471.30M | 413.55M | 354.04M | 279.17M | 218.52M | 184.87M |
| Gross Profit | 69.30M | 964.30M | 932.80M | 813.90M | 591.80M | 547.50M | 504.30M | 435.30M | 375.10M | 312.90M | 247.50M | 207.30M | 184.76M | 161.65M | 122.83M | 102.80M | 87.98M |
| Gross Profit Ratio | 2.45% | 38.36% | 37.34% | 34.90% | 33.69% | 34.24% | 34.45% | 34.25% | 33.87% | 32.98% | 31.25% | 30.55% | 30.88% | 31.35% | 30.55% | 31.99% | 32.24% |
| Research & Development | 0.00 | 0.00 | 4.60M | 100.00K | 100.00K | 0.00 | 200.00K | 100.00K | 0.00 | 0.00 | 0.00 | 5.30M | 0.00 | 0.00 | 0.00 | 0.00 | 0.00 |
| General & Administrative | 0.00 | 758.20M | 577.60M | 343.00M | 314.20M | 167.00M | 117.70M | 100.60M | 95.60M | 85.00M | 69.60M | 48.80M | -134.01M | -119.74M | 0.00 | 0.00 | 0.00 |
| Selling & Marketing | 0.00 | 831.80M | 673.90M | 653.40M | 571.80M | 485.40M | 434.20M | 365.70M | 309.40M | 253.10M | 200.00M | 169.80M | 151.73M | 132.81M | 110.33M | 101.07M | 93.54M |
| SG&A | -185.50M | 1.59B | 1.25B | 996.40M | 886.00M | 652.40M | 551.90M | 466.30M | 405.00M | 338.10M | 269.60M | 218.60M | 17.71M | 13.07M | 110.33M | 101.07M | 93.54M |
| Other Expenses | 398.40M | 13.40M | 13.20M | 13.20M | 13.30M | 13.40M | 12.90M | 14.30M | 13.70M | 11.40M | 3.90M | 0.00 | 0.00 | 0.00 | 0.00 | 0.00 | 0.00 |
| Operating Expenses | 212.90M | 1.42B | 1.07B | 908.80M | 802.10M | 580.50M | 490.90M | 413.40M | 356.00M | 298.70M | 246.50M | 201.90M | 183.57M | 167.05M | 136.10M | 124.26M | 117.33M |
| Cost & Expenses | 3.16B | 2.97B | 2.63B | 2.43B | 1.97B | 1.63B | 1.45B | 1.25B | 1.09B | 934.70M | 791.10M | 673.20M | 597.12M | 521.09M | 415.27M | 342.77M | 302.21M |
| Interest Income | 45.60M | 13.50M | 1.60M | 5.50M | 3.30M | 2.20M | 200.00K | 200.00K | 200.00K | 400.00K | 400.00K | 400.00K | 1.17M | 569.00K | 12.00K | 99.00K | 824.00K |
| Interest Expense | 95.80M | 90.00M | 71.60M | 55.90M | 30.90M | 14.70M | 13.90M | 9.70M | 9.40M | 9.50M | 7.20M | 3.90M | 5.05M | 8.36M | 11.11M | 11.67M | 10.73M |
| Depreciation & Amortization | 452.70M | 335.10M | 228.00M | 163.50M | 133.70M | 90.40M | 70.40M | 59.60M | 60.10M | 55.00M | 43.70M | 29.00M | 26.72M | 23.81M | 22.61M | 23.74M | 20.02M |
| EBITDA | 146.20M | -87.60M | 122.70M | 76.20M | 49.40M | 61.60M | 76.60M | 82.80M | 81.60M | 57.70M | 36.30M | 33.30M | 28.80M | 19.95M | 8.21M | 2.11M | -9.41M |
| EBITDA Ratio | 5.18% | -3.48% | 4.99% | 3.27% | 1.52% | 3.86% | 5.89% | 6.70% | 7.37% | 7.59% | 5.81% | 5.13% | 4.95% | 3.68% | 2.31% | 0.72% | -3.17% |
| Operating Income | -333.20M | -452.60M | -134.60M | 8.80M | -185.80M | -31.90M | 14.70M | 21.60M | 21.40M | 16.30M | -2.70M | 3.00M | 1.07M | -5.36M | -14.40M | -21.61M | -30.09M |
| Operating Income Ratio | -11.79% | -18.00% | -5.39% | 0.38% | -10.58% | -2.00% | 1.00% | 1.70% | 1.93% | 1.72% | -0.34% | 0.44% | 0.18% | -1.04% | -3.58% | -6.73% | -11.03% |
| Total Other Income/Expenses | -70.00M | -48.20M | -42.30M | -52.80M | -28.70M | -12.50M | -13.70M | -9.50M | -9.50M | -9.10M | -9.80M | -6.10M | -3.52M | -6.86M | -11.11M | -11.69M | -10.06M |
| Income Before Tax | -403.20M | -500.80M | -176.90M | -44.00M | -214.50M | -44.40M | 1.00M | 12.10M | 11.90M | 7.20M | -12.50M | -600.00K | -2.42M | -12.21M | -25.51M | -33.30M | -40.15M |
| Income Before Tax Ratio | -14.27% | -19.92% | -7.08% | -1.89% | -12.21% | -2.78% | 0.07% | 0.95% | 1.07% | 0.76% | -1.58% | -0.09% | -0.40% | -2.37% | -6.35% | -10.36% | -14.72% |
| Income Tax Expense | -16.20M | -19.50M | 8.80M | 25.60M | -2.70M | 500.00K | 500.00K | 100.00K | 100.00K | -100.00K | 5.00M | 1.80M | -1.92M | -5.00M | -2.30M | 196.00K | 1.44M |
| Net Income | -314.00M | -455.50M | -223.20M | -126.00M | -213.10M | -44.90M | 1.00M | 12.00M | 11.80M | 7.30M | -12.50M | -2.40M | -503.00K | -7.21M | -23.21M | -33.30M | -40.15M |
| Net Income Ratio | -11.12% | -18.12% | -8.93% | -5.40% | -12.13% | -2.81% | 0.07% | 0.94% | 1.07% | 0.77% | -1.58% | -0.35% | -0.08% | -1.40% | -5.77% | -10.36% | -14.72% |
| EPS | -0.38 | -0.59 | -0.30 | -0.18 | -0.29 | -0.07 | 0.00 | 0.02 | 0.02 | 0.01 | -0.02 | 0.00 | 0.00 | -0.02 | -0.06 | -0.07 | -0.08 |
| EPS Diluted | -0.38 | -0.59 | -0.30 | -0.18 | -0.29 | -0.07 | 0.00 | 0.02 | 0.02 | 0.01 | -0.02 | 0.00 | 0.00 | -0.02 | -0.06 | -0.07 | -0.08 |
| Weighted Avg Shares Out | 816.50M | 772.90M | 739.50M | 718.00M | 725.70M | 655.40M | 599.50M | 594.40M | 588.30M | 584.90M | 578.70M | 523.30M | 521.70M | 400.05M | 383.36M | 497.48M | 497.48M |
| Weighted Avg Shares Out (Dil) | 816.50M | 772.90M | 739.50M | 718.00M | 725.70M | 655.40M | 619.30M | 613.50M | 619.40M | 614.30M | 580.00M | 523.30M | 521.70M | 442.22M | 383.36M | 497.48M | 497.48M |
Ocado Retail quarterly sales up 10.6% as it wins more customers

Ocado investors seeking calm in results after M&S spat
Ocado continues to shed value after M&S fallout

Ocado expects negotiated settlement with M&S over final jv payment
Ocado may sue M&S over payment for Ocado.com joint venture

Ocado reports lesser spotted profit
Ocado's annual loss narrows to 403 million pounds
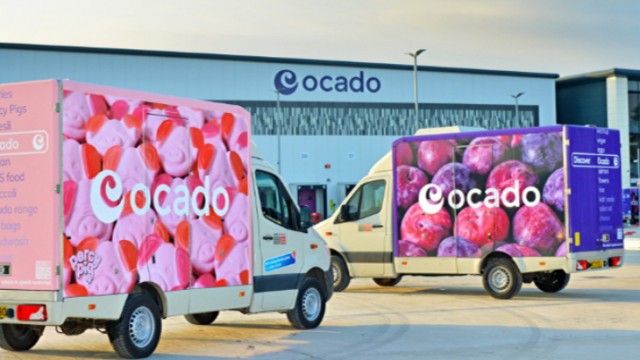
Ocado tumbles as M&S may withhold payment, analysts calls for name change

Top FTSE 100 and FTSE 250 shares to watch: Abrdn, IAG, Ocado and more

British Airways, Ocado and Haleon to set next week's pace
Source: https://incomestatements.info
Category: Stock Reports
