See more : Appen Limited (APPEF) Income Statement Analysis – Financial Results
Complete financial analysis of Orbital Energy Group, Inc. (OEG) income statement, including revenue, profit margins, EPS and key performance metrics. Get detailed insights into the financial performance of Orbital Energy Group, Inc., a leading company in the Engineering & Construction industry within the Industrials sector.
- Laurent-Perrier S.A. (LPE.PA) Income Statement Analysis – Financial Results
- Ramelius Resources Limited (RMS.AX) Income Statement Analysis – Financial Results
- Eastern Silk Industries Limited (EASTSILK.BO) Income Statement Analysis – Financial Results
- JRjr33, Inc. (JRJRQ) Income Statement Analysis – Financial Results
- Ning Xia Yin Xing Energy Co.,Ltd (000862.SZ) Income Statement Analysis – Financial Results
Orbital Energy Group, Inc. (OEG)
About Orbital Energy Group, Inc.
Orbital Energy Group, Inc. provides electric power, telecommunications, and renewables solutions and services in the United States and India. It designs, installs, upgrades, repairs, and maintains electric power transmission and distribution infrastructure, and substation facilities, as well as offers emergency restoration services, including the repair of infrastructure damaged by inclement weather; and provides services to the electric transmission and substation, industrial, telecommunication, and disaster restoration market sectors. The company also offers engineering, design, construction, and maintenance services to the broadband and wireless telecommunication industries; enterprise solutions to the cable and telecommunication industries; and telecommunication services, such as various wireless service capabilities. In addition, it provides engineering, procurement, and construction services that support the development of renewable energy generation focused on utility-scale solar construction. Orbital Energy Group, Inc. was incorporated in 1998 and is headquartered in Houston, Texas.
| Metric | 2021 | 2020 | 2019 | 2018 | 2017 | 2016 | 2015 | 2014 | 2013 | 2012 | 2011 | 2010 | 2009 | 2008 | 2007 | 2006 | 2005 | 2004 | 2003 | 2002 | 2001 | 2000 | 1999 |
|---|---|---|---|---|---|---|---|---|---|---|---|---|---|---|---|---|---|---|---|---|---|---|---|
| Revenue | 82.95M | 38.41M | 23.49M | 96.79M | 83.28M | 86.46M | 86.67M | 76.05M | 60.65M | 41.08M | 38.94M | 40.93M | 28.85M | 19.56M | 157.26K | 256.69K | 133.65K | 145.99K | 308.63K | 615.48K | 0.00 | 1.00 | 49.18K |
| Cost of Revenue | 85.39M | 31.32M | 17.68M | 67.88M | 55.41M | 54.20M | 54.38M | 47.49M | 36.88M | 25.71M | 24.13M | 25.70M | 18.19M | 11.87M | 2.32M | 1.59M | 170.53K | 0.00 | 125.02K | 187.30K | 0.00 | 0.00 | 0.00 |
| Gross Profit | -2.44M | 7.10M | 5.81M | 28.91M | 27.87M | 32.26M | 32.29M | 28.55M | 23.77M | 15.38M | 14.81M | 15.23M | 10.66M | 7.68M | -2.16M | -1.33M | -36.88K | 145.99K | 183.61K | 428.18K | 0.00 | 1.00 | 49.18K |
| Gross Profit Ratio | -2.95% | 18.48% | 24.74% | 29.87% | 33.47% | 37.31% | 37.26% | 37.54% | 39.20% | 37.43% | 38.02% | 37.22% | 36.95% | 39.28% | -1,374.39% | -518.19% | -27.60% | 100.00% | 59.49% | 69.57% | 0.00% | 100.00% | 100.00% |
| Research & Development | 0.00 | 45.00K | 139.00K | 2.80M | 2.53M | 2.02M | 1.85M | 1.17M | 890.46K | 791.33K | 716.32K | 740.40K | 56.04K | 513.67K | 1.19M | 2.66M | 1.42M | 1.04M | 0.00 | 0.00 | 0.00 | 0.00 | 0.00 |
| General & Administrative | 0.00 | 29.40M | 20.06M | 36.34M | 33.92M | 34.24M | 33.02M | 26.06M | 19.50M | 16.22M | 13.35M | 13.27M | 10.84M | 7.62M | 1.89M | 7.69M | 4.94M | 6.94M | 3.19M | 3.17M | 1.27M | 896.53K | 141.85K |
| Selling & Marketing | 0.00 | 0.00 | 0.00 | 0.00 | 0.00 | 0.00 | 0.00 | 0.00 | 0.00 | 0.00 | 0.00 | 0.00 | 0.00 | 0.00 | 0.00 | 0.00 | 0.00 | 0.00 | 0.00 | 0.00 | 0.00 | 0.00 | 0.00 |
| SG&A | 50.02M | 29.40M | 20.06M | 36.34M | 33.92M | 34.24M | 33.02M | 26.06M | 19.50M | 16.22M | 13.35M | 13.27M | 10.84M | 7.62M | 1.89M | 7.69M | 4.94M | 6.94M | 3.19M | 3.17M | 1.27M | 896.53K | 141.85K |
| Other Expenses | 7.09M | 6.41M | 1.66M | 2.20M | 2.20M | 2.52M | 3.12M | 4.16M | 3.49M | 65.76K | 82.19K | 72.69K | 144.83K | 148.57K | 39.44K | -1.22M | 11.78K | 213.86K | 270.36K | -2.44M | -89.22K | 140.89K | 353.31K |
| Operating Expenses | 57.11M | 35.85M | 21.86M | 41.34M | 38.64M | 38.77M | 37.99M | 31.39M | 23.88M | 17.08M | 14.15M | 14.08M | 11.04M | 8.28M | 3.12M | 9.14M | 6.37M | 8.19M | 3.46M | 729.88K | 1.18M | 1.04M | 495.16K |
| Cost & Expenses | 142.50M | 67.17M | 39.54M | 109.22M | 94.05M | 92.97M | 92.36M | 78.88M | 60.76M | 42.79M | 38.28M | 39.78M | 29.23M | 20.15M | 5.44M | 10.72M | 6.54M | 8.19M | 3.59M | 917.18K | 1.18M | 1.04M | 495.16K |
| Interest Income | 0.00 | 293.00K | 82.00K | 35.00K | 20.00K | 16.00K | 38.00K | 0.00 | 0.00 | 0.00 | 0.00 | 0.00 | 0.00 | 0.00 | 0.00 | 0.00 | 0.00 | 0.00 | 0.00 | 0.00 | 0.00 | 0.00 | 0.00 |
| Interest Expense | 8.34M | 1.30M | 61.00K | 502.00K | 500.00K | 467.00K | 441.00K | 508.12K | 485.63K | 648.53K | 1.25M | 5.07M | 4.65M | 3.70M | 622.02K | 4.04M | 2.01M | 64.07K | 273.55K | 264.92K | 76.79K | 63.59K | 0.00 |
| Depreciation & Amortization | 5.21M | 5.24M | 2.36M | 3.01M | 2.85M | 2.85M | 3.21M | 4.44M | 3.28M | 730.29K | 770.76K | 835.57K | 685.45K | 523.71K | 299.53K | 947.63K | 639.26K | 2.36M | 376.08K | 173.87K | 197.79K | 140.89K | 23.07K |
| EBITDA | -58.22M | -24.45M | -1.66M | -14.02M | -10.85M | -3.91M | -2.75M | 1.42M | 2.42M | -1.11M | 2.00M | -993.52K | 1.14M | 2.40M | -4.83M | -9.49M | -5.83M | -5.48M | -2.79M | -3.00M | -909.55K | -742.13K | -422.91K |
| EBITDA Ratio | -70.18% | -63.65% | -7.08% | -14.49% | -13.02% | -4.53% | -3.17% | 1.87% | 4.00% | -2.71% | 5.15% | -2.43% | 3.94% | 12.26% | -3,068.28% | -3,697.50% | -4,362.39% | -3,751.92% | -903.62% | -488.23% | 0.00% | -74,213,200.00% | -860.00% |
| Operating Income | -63.42M | -28.75M | -16.05M | -16.78M | -13.93M | -6.51M | -5.69M | -2.90M | -106.84K | -1.98M | 658.89K | -2.37M | -11.22M | -843.91K | -5.28M | -10.48M | -6.49M | -8.05M | -3.28M | -301.70K | -1.18M | -1.04M | -445.99K |
| Operating Income Ratio | -76.46% | -74.85% | -68.30% | -17.33% | -16.73% | -7.53% | -6.57% | -3.81% | -0.18% | -4.82% | 1.69% | -5.80% | -38.87% | -4.32% | -3,358.01% | -4,082.43% | -4,855.86% | -5,513.27% | -1,062.79% | -49.02% | 0.00% | -103,742,500.00% | -906.92% |
| Total Other Income/Expenses | -10.51M | -5.15M | -537.00K | -753.00K | -266.00K | -718.00K | -701.00K | -726.17K | -1.23M | -512.41K | -1.05M | -4.97M | 7.01M | 2.47M | 116.65K | 1.25M | -70.32K | -5.31K | -155.17K | -229.66K | 363.80K | 154.40K | 0.00 |
| Income Before Tax | -60.35M | -33.90M | -16.58M | -17.53M | -14.20M | -7.23M | -6.40M | -3.53M | -1.34M | -2.49M | -393.96K | -7.35M | -4.21M | 1.63M | -5.16M | -9.23M | -6.56M | -8.05M | -3.44M | -531.37K | -820.33K | -883.03K | 0.00 |
| Income Before Tax Ratio | -72.76% | -88.26% | -70.59% | -18.11% | -17.05% | -8.36% | -7.38% | -4.64% | -2.21% | -6.07% | -1.01% | -17.95% | -14.59% | 8.32% | -3,283.83% | -3,597.07% | -4,908.47% | -5,516.90% | -1,113.07% | -86.33% | 0.00% | -88,302,500.00% | 0.00% |
| Income Tax Expense | -10.51M | -3.55M | -2.96M | -206.00K | -1.61M | 38.00K | -408.00K | -726.17K | 417.12K | 33.71K | 29.81K | 111.94K | 11.65M | 6.18M | 738.67K | 5.29M | 1.94M | 58.77K | 118.38K | 35.26K | 440.59K | 217.99K | 0.00 |
| Net Income | -49.84M | -27.45M | -1.13M | -17.33M | -12.59M | -7.27M | -5.99M | -2.80M | -1.76M | -2.53M | -48.76K | -7.02M | -4.20M | -1.83M | -5.75M | -14.48M | -8.48M | -7.90M | -3.44M | -3.44M | -1.18M | -946.61K | -445.99K |
| Net Income Ratio | -60.09% | -71.45% | -4.81% | -17.90% | -15.12% | -8.40% | -6.91% | -3.68% | -2.90% | -6.15% | -0.13% | -17.14% | -14.55% | -9.36% | -3,654.29% | -5,641.61% | -6,346.52% | -5,414.30% | -1,114.11% | -559.53% | 0.00% | -94,661,300.00% | -906.92% |
| EPS | -0.85 | -0.92 | -0.04 | -0.61 | -0.56 | -0.35 | -0.29 | -0.14 | -0.10 | -0.25 | -0.01 | -1.12 | -0.75 | -0.34 | -1.14 | -3.76 | -3.63 | -6.56 | -8.53 | -11.68 | -4.97 | -5.40 | -4.30 |
| EPS Diluted | -0.85 | -0.92 | -0.04 | -0.61 | -0.56 | -0.35 | -0.29 | -0.14 | -0.10 | -0.25 | -0.01 | -1.12 | -0.75 | -0.34 | -1.14 | -3.76 | -3.63 | -6.56 | -8.53 | -11.68 | -4.96 | -5.40 | -4.30 |
| Weighted Avg Shares Out | 58.35M | 29.94M | 28.65M | 28.52M | 22.40M | 20.90M | 20.79M | 20.66M | 17.75M | 10.18M | 7.25M | 6.29M | 5.62M | 5.40M | 5.03M | 3.85M | 2.34M | 1.20M | 402.90K | 294.94K | 238.33K | 175.17K | 103.73K |
| Weighted Avg Shares Out (Dil) | 58.35M | 29.94M | 28.65M | 28.52M | 22.40M | 20.90M | 20.79M | 20.66M | 17.75M | 10.18M | 7.25M | 6.29M | 5.62M | 5.40M | 5.03M | 3.85M | 2.34M | 1.20M | 402.90K | 294.94K | 238.64K | 175.17K | 103.73K |

Head to Head Review: Arrow Electronics (NYSE:ARW) vs. Orbital Energy Group (NYSE:OEG)

Large Study Demonstrates Exceptional Safety and High Procedural Success With Cardiovascular Systems’ Diamondback 360® Coronary Orbital Atherectomy System (OAS)

Mid-Day Market Update: Gold Gains 2%; ShiftPixy Shares Plunge

Ricky Martin: de la vida loca a empresario de "viajes auditivos"

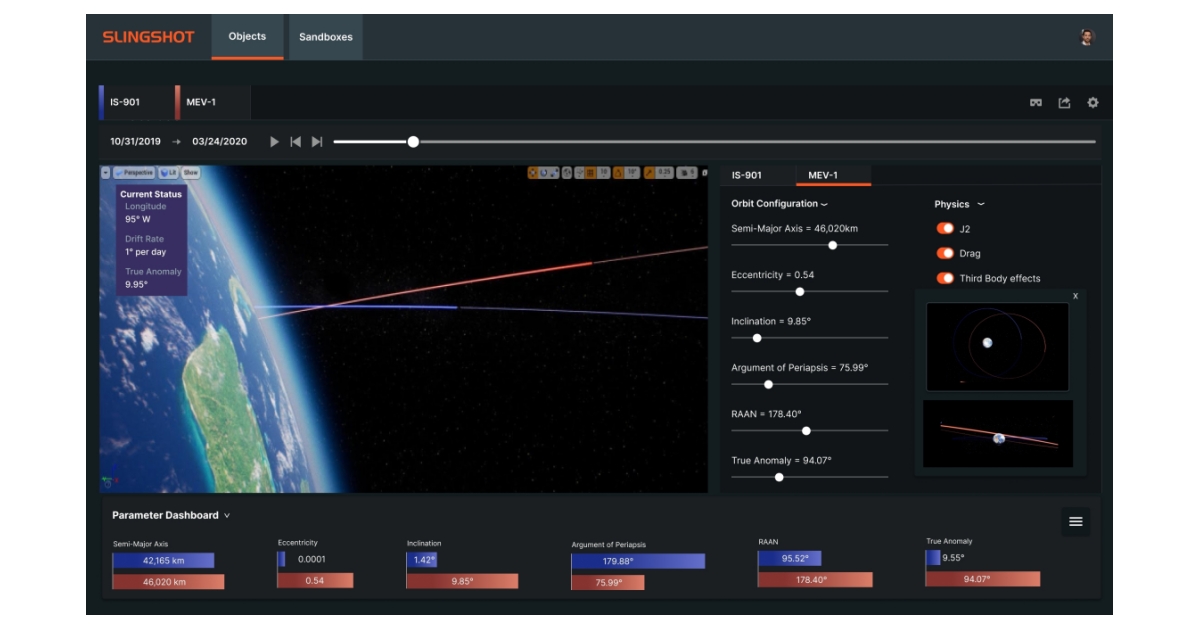
Slingshot Aerospace & Leading Hollywood Visualization Studio THE THIRD FLOOR Reimagine Next-Gen Space Training

Cardiovascular Systems Announces Presentation of Data From Large Coronary Orbital Atherectomy Study at the TCT Connect 2020 Conference

Unilever is using geolocation data and satellite imagery to check for deforestation in its supply chain

Jeff Bezos' Blue Origin is looking to hire a developer of habitable space stations

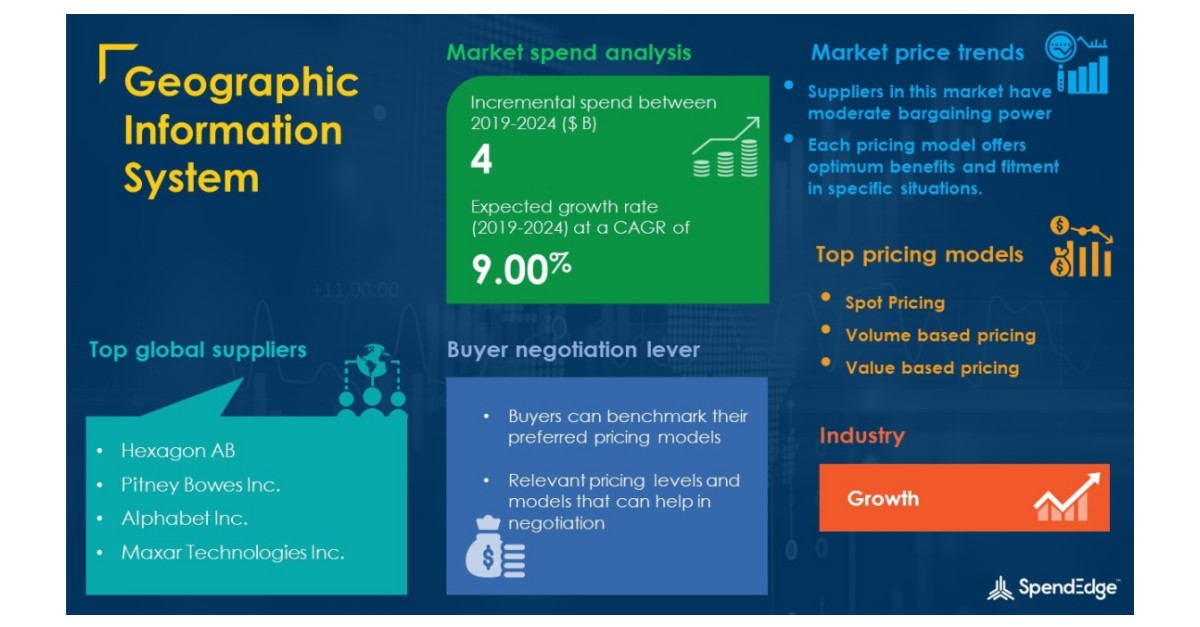
Geographic Information System Market Procurement Intelligence Report with COVID-19 Impact Analysis | Global Forecasts, 2019-2024

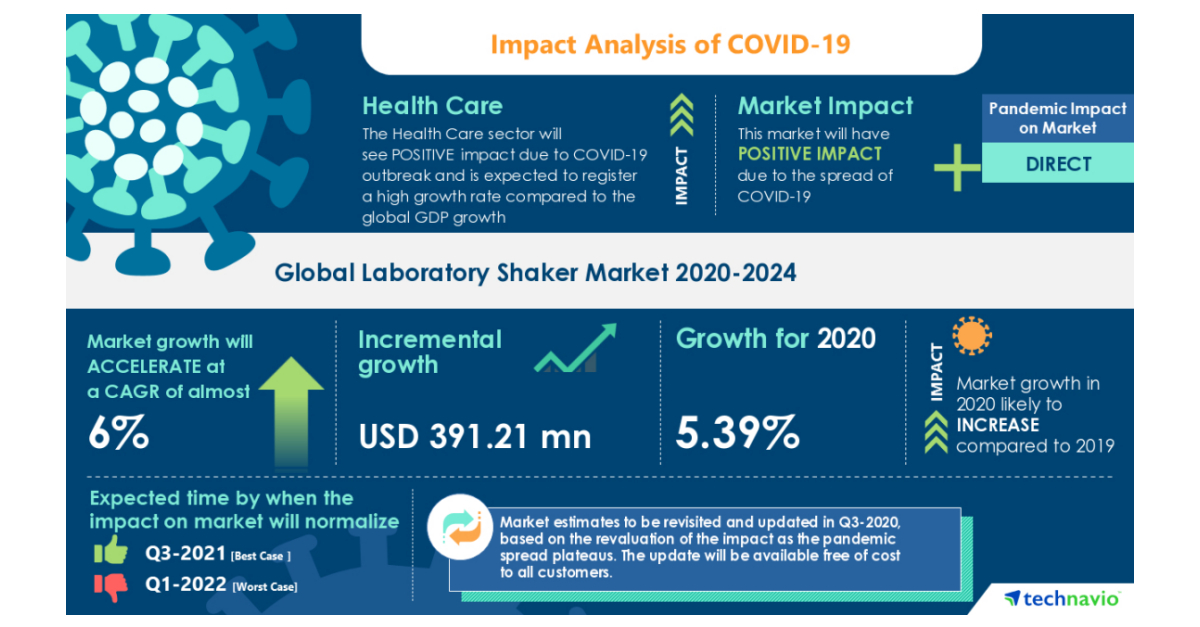
New Laboratory Shaker Market Research Highlights Recovery Path for Businesses from COVID-19 on based on Products- Orbital Shakers, Incubator Shakers, and Other Shakers | Technavio
Source: https://incomestatements.info
Category: Stock Reports
