Complete financial analysis of Empire State Realty OP, L.P. (OGCP) income statement, including revenue, profit margins, EPS and key performance metrics. Get detailed insights into the financial performance of Empire State Realty OP, L.P., a leading company in the REIT – Office industry within the Real Estate sector.
You may be interested
- InMed Pharmaceuticals Inc. (IN.TO) Income Statement Analysis – Financial Results
- ACMAT Corporation (ACMTA) Income Statement Analysis – Financial Results
- Accrete Inc. (4395.T) Income Statement Analysis – Financial Results
- Avanti Helium Corp. (AVN.V) Income Statement Analysis – Financial Results
- Fly-E Group, Inc. Common Stock (FLYE) Income Statement Analysis – Financial Results
Empire State Realty OP, L.P. (OGCP)
About Empire State Realty OP, L.P.
Empire State Realty OP, L.P. operates as a subsidiary of Empire State Realty Trust, Inc.
| Metric | 2023 | 2022 | 2021 | 2020 | 2019 | 2018 | 2017 | 2016 | 2015 | 2014 | 2013 | 2012 | 2011 | 2010 | 2009 | 2008 |
|---|---|---|---|---|---|---|---|---|---|---|---|---|---|---|---|---|
| Revenue | 739.57M | 727.04M | 624.09M | 609.23M | 731.34M | 731.51M | 712.47M | 678.00M | 657.63M | 635.33M | 311.85M | 260.29M | 294.79M | 246.55M | 232.32M | 268.80M |
| Cost of Revenue | 339.02M | 321.35M | 279.49M | 291.11M | 333.99M | 319.47M | 305.60M | 289.07M | 296.53M | 306.16M | 145.44M | 105.71M | 86.26M | 87.94M | 87.79M | 80.15M |
| Gross Profit | 400.56M | 405.69M | 344.61M | 318.12M | 397.36M | 412.04M | 406.87M | 388.93M | 361.11M | 329.17M | 166.41M | 154.59M | 208.53M | 158.60M | 144.53M | 188.64M |
| Gross Profit Ratio | 54.16% | 55.80% | 55.22% | 52.22% | 54.33% | 56.33% | 57.11% | 57.36% | 54.91% | 51.81% | 53.36% | 59.39% | 70.74% | 64.33% | 62.21% | 70.18% |
| Research & Development | 0.00 | 0.09 | -0.02 | -0.05 | 0.12 | 0.17 | 0.18 | 0.17 | 0.00 | 0.00 | 0.00 | 0.00 | 0.00 | 0.00 | 0.00 | 0.00 |
| General & Administrative | 63.94M | 61.77M | 55.95M | 62.24M | 61.06M | 52.67M | 50.32M | 49.08M | 38.07M | 39.04M | 42.57M | 23.21M | 0.00 | 0.00 | 0.00 | 0.00 |
| Selling & Marketing | 0.00 | 0.00 | 0.00 | 0.00 | 0.00 | 0.00 | 0.00 | 0.00 | 0.00 | 0.00 | 0.00 | 1.30M | 0.00 | 0.00 | 0.00 | 0.00 |
| SG&A | 63.94M | 61.77M | 55.95M | 62.24M | 61.06M | 52.67M | 50.32M | 49.08M | 38.07M | 39.04M | 42.57M | 23.21M | 61.92M | 41.51M | 33.43M | 73.84M |
| Other Expenses | 0.00 | 216.89M | 201.81M | 191.01M | 181.59M | 168.51M | 160.71M | 155.21M | 171.47M | 145.43M | 65.41M | 42.69M | 97.43M | 75.55M | 62.75M | 100.68M |
| Operating Expenses | 253.85M | 278.66M | 257.75M | 253.25M | 242.65M | 221.18M | 211.03M | 204.29M | 209.55M | 184.47M | 107.97M | 65.90M | 97.43M | 75.55M | 62.75M | 100.68M |
| Cost & Expenses | 592.87M | 600.01M | 537.24M | 544.36M | 576.64M | 540.65M | 516.62M | 493.36M | 506.07M | 490.62M | 253.41M | 171.61M | 183.69M | 163.49M | 150.54M | 180.84M |
| Interest Income | 15.14M | 4.95M | 704.00K | 2.64M | 11.26M | 10.66M | 2.94M | 647.00K | 0.00 | 0.00 | 0.00 | 0.00 | 0.00 | 0.00 | 0.00 | 0.00 |
| Interest Expense | 101.48M | 101.21M | 94.39M | 89.91M | 79.25M | 79.62M | 68.47M | 71.15M | 67.49M | 66.46M | 56.96M | 54.39M | 54.75M | 52.26M | 50.74M | 48.66M |
| Depreciation & Amortization | 189.91M | 600.01M | 537.24M | 551.96M | 587.54M | 552.75M | 533.72M | 518.06M | 171.47M | 145.43M | 70.96M | 47.57M | 38.76M | 36.03M | 30.86M | 28.16M |
| EBITDA | 336.62M | 343.92M | 288.66M | 251.05M | 355.38M | 359.37M | 331.62M | 313.94M | 323.04M | 286.75M | 142.05M | 131.38M | 149.86M | 116.29M | 112.64M | 116.12M |
| EBITDA Ratio | 45.52% | 47.98% | 46.37% | 42.43% | 47.52% | 50.58% | 50.05% | 50.13% | 49.12% | 45.67% | 105.38% | 57.86% | 50.83% | 48.30% | 48.48% | 43.20% |
| Operating Income | 146.71M | 127.03M | 79.13M | 58.66M | 154.71M | 190.86M | 195.85M | 184.54M | 151.37M | 141.32M | 58.44M | 88.69M | 111.10M | 83.06M | 81.78M | 87.96M |
| Operating Income Ratio | 19.84% | 17.47% | 12.68% | 9.63% | 21.15% | 26.09% | 27.49% | 27.22% | 23.02% | 22.24% | 18.74% | 34.07% | 37.69% | 33.69% | 35.20% | 32.72% |
| Total Other Income/Expenses | -59.58M | -62.27M | -93.90M | -88.52M | -67.99M | -68.96M | -70.92M | -70.50M | -67.49M | -66.46M | 218.63M | -40.05M | -51.90M | -36.94M | -50.74M | -48.66M |
| Income Before Tax | 87.12M | 64.76M | -14.77M | -29.86M | 86.72M | 121.90M | 124.93M | 113.40M | 83.88M | 74.87M | 200.71M | 48.64M | 56.35M | 30.79M | 31.04M | 39.30M |
| Income Before Tax Ratio | 11.78% | 8.91% | -2.37% | -4.90% | 11.86% | 16.66% | 17.53% | 16.73% | 12.75% | 11.78% | 64.36% | 18.69% | 19.12% | 12.49% | 13.36% | 14.62% |
| Income Tax Expense | 2.72M | 1.55M | -1.73M | -6.97M | 2.43M | 4.64M | 6.67M | 6.15M | 3.95M | 4.66M | 374.39M | 68.74M | -3.89M | -15.32M | -10.80M | -13.42M |
| Net Income | 53.25M | 63.21M | -13.04M | -22.89M | 84.29M | 66.54M | 63.58M | 52.39M | 34.67M | 27.14M | 82.53M | 48.64M | 60.24M | 46.12M | 41.84M | 52.72M |
| Net Income Ratio | 7.20% | 8.69% | -2.09% | -3.76% | 11.53% | 9.10% | 8.92% | 7.73% | 5.27% | 4.27% | 26.46% | 18.69% | 20.44% | 18.71% | 18.01% | 19.61% |
| EPS | 0.50 | 0.38 | -0.08 | -0.13 | 0.47 | 0.38 | 0.40 | 0.38 | 0.30 | 0.27 | 0.79 | 0.53 | 0.66 | 0.49 | 0.46 | 0.58 |
| EPS Diluted | 0.30 | 0.23 | -0.05 | -0.08 | 0.29 | 0.22 | 0.39 | 0.38 | 0.29 | 0.27 | 0.79 | 0.53 | 0.66 | 0.49 | 0.46 | 0.58 |
| Weighted Avg Shares Out | 161.12M | 165.04M | 172.45M | 175.17M | 178.34M | 173.84M | 158.38M | 133.88M | 114.25M | 97.94M | 95.46M | 91.66M | 91.66M | 91.66M | 91.66M | 91.66M |
| Weighted Avg Shares Out (Dil) | 265.63M | 269.95M | 274.98M | 278.18M | 294.75M | 297.26M | 298.05M | 277.57M | 266.62M | 254.51M | 95.61M | 91.66M | 91.66M | 91.66M | 91.66M | 91.66M |

CVS/Aetna to waive cost sharing for coronavirus-related inpatient care
Aetna announced on Wednesday that it would waive cost-sharing and co-payments for in-network patient admissions related to the coronavirus outbreak.

New York's coronavirus battle will have lessons for the U.S.
New York's fight against coronavirus is also the nation's fight, as the state emerges as ground zero.

The coronavirus crisis is the moment Andrew Cuomo has prepared for all his life
The measures Andrew Cuomo has taken to fight coronavirus come from a man who has been preparing for this moment his entire life.

When A Bull Turns Bear – Stocks May Still Fall 20% Further
Earnings estimates continue to drop as the economic impact of the coronavirus is now beginning to show its ugly head. This week, a few data points for March showed that the potential economic impact on the country could be devastating.

ECB's Bazooka Support Bonds but not the Euro
Breaking Down and Making Sense of the Global Capital Markets with Political Economist Marc Chandler

3 Breathtaking Scenic Drives in New York
Photo: Dion Hinchcliffe via CCThe Empire State is positively teeming with natural wonders and historic treasures. Here’s a look at three scenic drives you can take to explore some of the beaut

Total Pukefest: Futures Soar Limit Up, Crash, Then Soar Again
The thing about the VIX at 80 - a level it did not hit even during the financial crisis - is that nobody has seen a market as volatile as like this.

Dr. Birx on call to use military in coronavirus response: 'We are looking at every single possible solution'
White House Coronavirus Response Coordinator Dr. Deborah Birx joined "Tucker Carlson Tonight" Monday to discuss the federal response to the coronavirus outbreak and responded to one governor's idea to utilize the military.

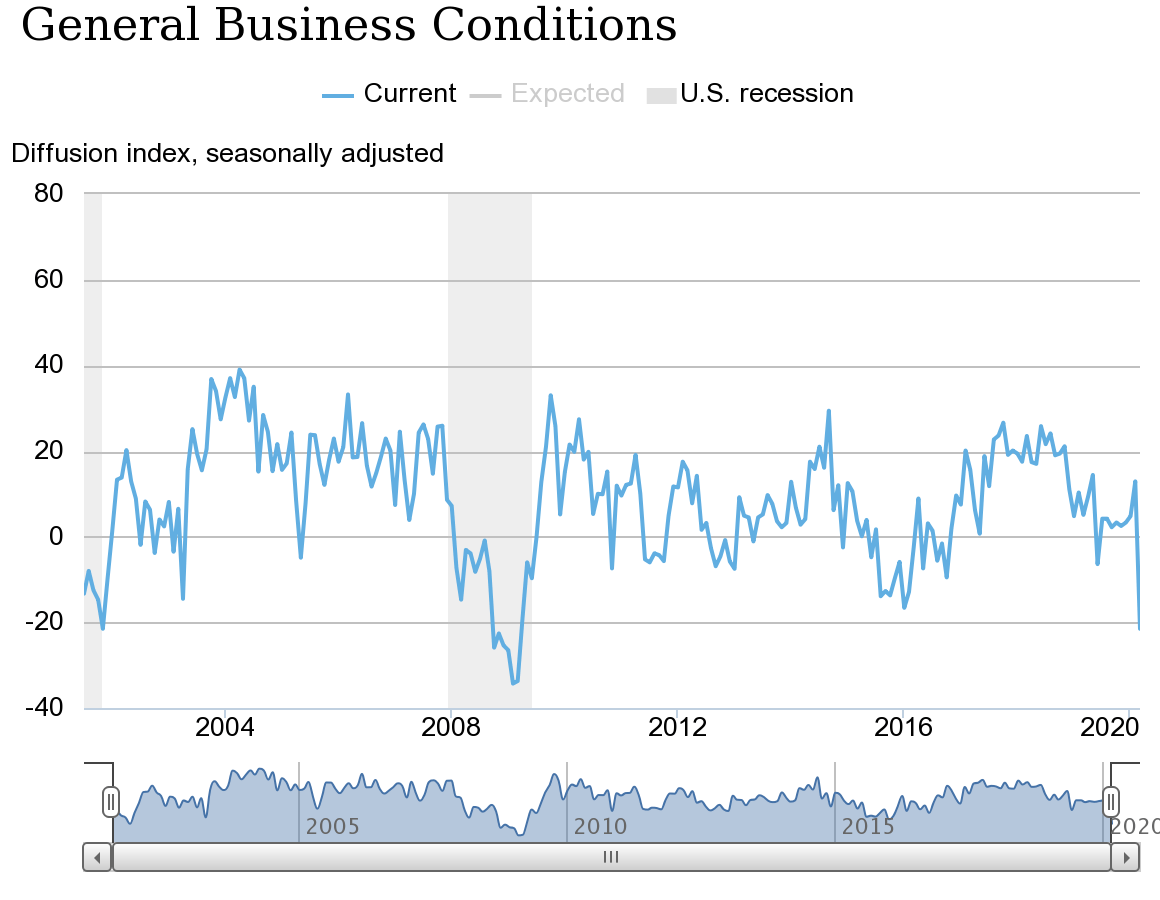
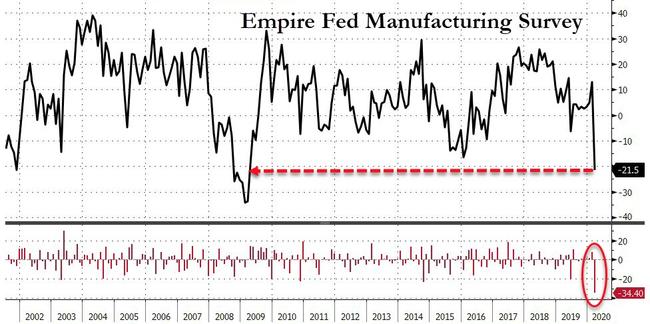
Empire State manufacturing index sees record decline to -21.5 in March
The numbers:The New York Fed’s Empire State business conditions index plunged a record 34.4 points to -21.5 in March, the regional Fed bank said Monday....

Empire Fed Survey Crashes By Most Ever To 11-Year-Lows
Manufacturers in New York expect a gloomier future too. The index of future business conditions also dropped to an 11-year low...
Source: https://incomestatements.info
Category: Stock Reports
