See more : The Sage Group plc (SGE.L) Income Statement Analysis – Financial Results
Complete financial analysis of OMV Aktiengesellschaft (OMVJF) income statement, including revenue, profit margins, EPS and key performance metrics. Get detailed insights into the financial performance of OMV Aktiengesellschaft, a leading company in the Oil & Gas Integrated industry within the Energy sector.
- Vippy Spinpro Limited (VIPPYSP.BO) Income Statement Analysis – Financial Results
- Xin Chio Global Co., Ltd. (3171.TWO) Income Statement Analysis – Financial Results
- Zhejiang Bofay Electric Co.,Ltd. (001255.SZ) Income Statement Analysis – Financial Results
- Electricité de France S.A. (E2F.DE) Income Statement Analysis – Financial Results
- IKK Holdings Inc . (2198.T) Income Statement Analysis – Financial Results
OMV Aktiengesellschaft (OMVJF)
About OMV Aktiengesellschaft
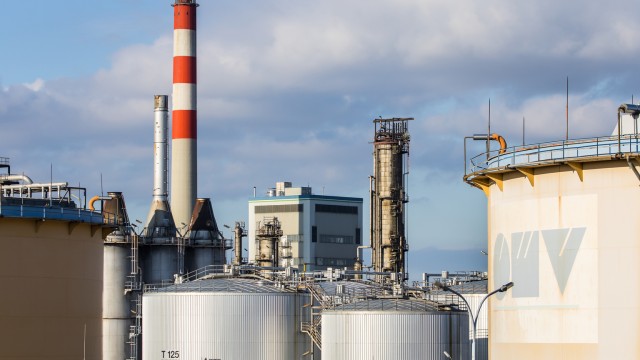
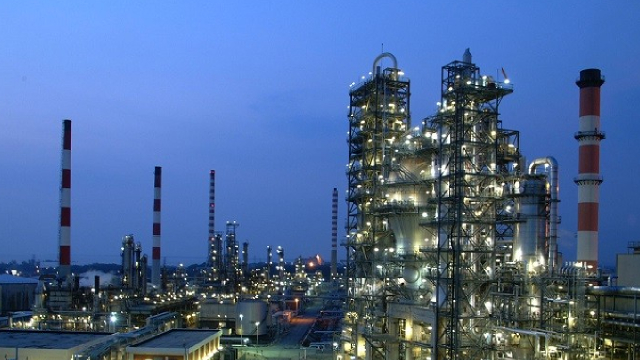
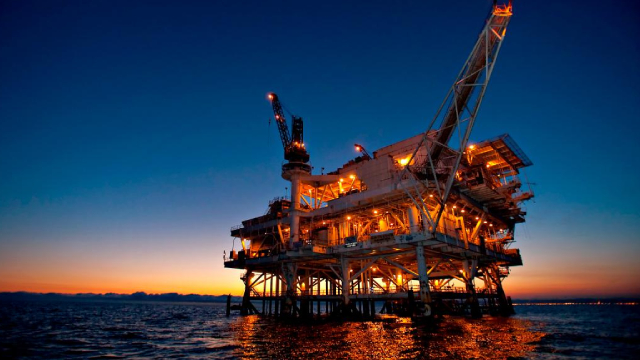
OMV Aktiengesellschaft operates as an energy and chemicals company in Austria, Germany, Romania, Norway, New Zealand, the United Arab Emirates, the rest of Central and Eastern Europe, the rest of Europe, and internationally. The company operates through Exploration & Production, Refining & Marketing, and Chemicals & Materials segments. The Exploration & Production segment engages in the exploration, development, and production of oil and gas in the regions of Central and Eastern Europe, the Middle East and Africa, the North Sea, and the Asia Pacific. The Refining & Marketing segment is involved in the refining and marketing of fuels and other feedstock. It has 3 inland refineries in Europe; approximately 2,100 filling stations in ten European countries; and gas storage facilities in Austria and Germany, as well as a gas-fired power plant in Romania. This segment is also involved in the supply, marketing, and trading of gas in Europe and Turkey. The Chemicals & Materials segment provides advanced and circular polyolefin solutions, base chemicals, and fertilizers, as well as engages in the recycling of plastics. The company was founded in 1956 and is headquartered in Vienna, Austria.
| Metric | 2023 | 2022 | 2021 | 2020 | 2019 | 2018 | 2017 | 2016 | 2015 | 2014 | 2013 | 2012 | 2011 | 2010 | 2009 | 2008 | 2007 | 2006 | 2005 |
|---|---|---|---|---|---|---|---|---|---|---|---|---|---|---|---|---|---|---|---|
| Revenue | 38.54B | 62.30B | 35.56B | 16.55B | 23.46B | 22.93B | 20.22B | 19.26B | 22.53B | 35.91B | 42.41B | 42.65B | 34.05B | 23.32B | 17.92B | 25.54B | 20.04B | 18.97B | 15.58B |
| Cost of Revenue | 28.23B | 48.04B | 27.24B | 14.68B | 18.21B | 17.97B | 16.36B | 17.72B | 23.21B | 33.31B | 38.58B | 37.82B | 29.60B | 19.43B | 14.92B | 20.94B | 16.17B | 15.24B | 12.14B |
| Gross Profit | 10.31B | 14.26B | 8.31B | 1.88B | 5.25B | 4.96B | 3.86B | 1.54B | -681.00M | 2.61B | 3.84B | 4.83B | 4.46B | 3.89B | 3.00B | 4.60B | 3.87B | 3.73B | 3.44B |
| Gross Profit Ratio | 26.76% | 22.88% | 23.38% | 11.33% | 22.37% | 21.62% | 19.10% | 7.99% | -3.02% | 7.26% | 9.04% | 11.32% | 13.09% | 16.68% | 16.75% | 18.01% | 19.32% | 19.65% | 22.07% |
| Research & Development | 76.00M | 65.00M | 58.00M | 61.00M | 49.00M | 40.00M | 33.00M | 28.00M | 28.00M | 25.00M | 16.94M | 21.04M | 15.94M | 15.80M | 14.44M | 13.64M | 15.46M | 13.24M | 12.19M |
| General & Administrative | 108.00M | 0.00 | 0.00 | 1.90B | 1.89B | 1.75B | 1.64B | 343.00M | 371.00M | 416.00M | 417.69M | 421.75M | 791.28M | 566.02M | 538.93M | 613.14M | 323.79M | 468.00M | 435.53M |
| Selling & Marketing | 3.01B | 2.69B | 2.75B | 1.90B | 1.89B | 1.75B | 1.64B | 1.00B | 906.00M | 950.00M | 963.05M | 1.02B | 947.10M | 755.51M | 800.12M | 881.62M | 900.20M | 913.86M | 910.08M |
| SG&A | 3.01B | 2.69B | 2.75B | 1.90B | 1.89B | 1.75B | 1.64B | 1.35B | 1.28B | 1.37B | 1.38B | 1.44B | 1.74B | 1.32B | 1.34B | 1.49B | 1.22B | 1.38B | 1.35B |
| Other Expenses | 2.00B | -434.00M | -72.00M | -1.34B | -25.00M | -406.00M | -311.00M | -428.00M | 36.00M | 17.00M | 10.66M | 11.89M | 8.04M | 9.97M | 11.64M | 91.58M | 53.23M | 45.26M | 0.00 |
| Operating Expenses | 5.09B | 2.32B | 2.73B | 620.00M | 1.92B | 1.73B | 2.64B | 2.00B | 1.33B | 1.55B | 1.12B | 1.72B | 1.98B | 1.56B | 1.59B | 2.26B | 1.69B | 1.67B | 1.48B |
| Cost & Expenses | 33.31B | 50.36B | 29.97B | 15.30B | 20.13B | 19.70B | 19.00B | 19.72B | 24.53B | 34.86B | 39.70B | 39.55B | 31.58B | 20.99B | 16.51B | 23.20B | 17.86B | 16.91B | 13.62B |
| Interest Income | 364.00M | 269.00M | 161.00M | 177.00M | 169.00M | 117.00M | 65.00M | 65.00M | 89.00M | 33.00M | 66.72M | 37.64M | 31.05M | 335.86M | 297.76M | -26.56M | 3.84M | 210.41M | 113.71M |
| Interest Expense | 416.00M | 417.00M | 333.00M | 280.00M | 305.00M | 289.00M | 265.00M | 260.00M | 303.00M | 362.00M | 300.09M | 413.71M | 382.84M | 139.01M | 297.76M | 213.49M | 127.43M | 108.76M | 124.04M |
| Depreciation & Amortization | 2.62B | 2.67B | 2.52B | 2.04B | 2.28B | 1.80B | 1.76B | 2.06B | 5.16B | 3.06B | 2.25B | 2.04B | 1.63B | 1.58B | 1.33B | 1.29B | 977.46M | 809.55M | 793.98M |
| EBITDA | 7.64B | 14.44B | 9.14B | 4.35B | 6.15B | 5.47B | 3.74B | 3.93B | 3.55B | 4.32B | 4.89B | 5.31B | 4.23B | 3.91B | 2.73B | 3.82B | 3.52B | 3.03B | 2.87B |
| EBITDA Ratio | 19.82% | 23.17% | 28.86% | 27.90% | 27.00% | 24.45% | 18.49% | 20.39% | 15.77% | 11.97% | 11.42% | 12.44% | 12.36% | 16.77% | 15.65% | 14.94% | 17.55% | 16.21% | 18.39% |
| Operating Income | 5.23B | 11.77B | 5.07B | 1.42B | 3.58B | 3.52B | 1.73B | 30.00M | -1.61B | 1.24B | 2.59B | 3.27B | 2.47B | 2.33B | 1.41B | 2.34B | 2.18B | 2.06B | 1.96B |
| Operating Income Ratio | 13.56% | 18.89% | 14.25% | 8.58% | 15.27% | 15.36% | 8.56% | 0.16% | -7.13% | 3.45% | 6.11% | 7.67% | 7.26% | 10.01% | 7.87% | 9.16% | 10.90% | 10.86% | 12.57% |
| Total Other Income/Expenses | -622.00M | -1.48B | -195.00M | -175.00M | -129.00M | -226.00M | -247.00M | -198.00M | -358.00M | -448.00M | -299.08M | -463.91M | -252.55M | -373.17M | -228.05M | -30.58M | 227.65M | 95.20M | -10.67M |
| Income Before Tax | 4.60B | 10.77B | 4.87B | 875.00M | 3.45B | 3.30B | 1.49B | -230.00M | -1.91B | 878.00M | 2.29B | 2.86B | 2.20B | 1.96B | 1.18B | 2.31B | 2.41B | 2.16B | 1.95B |
| Income Before Tax Ratio | 11.95% | 17.28% | 13.70% | 5.29% | 14.72% | 14.38% | 7.35% | -1.19% | -8.47% | 2.44% | 5.40% | 6.70% | 6.46% | 8.41% | 6.60% | 9.04% | 12.04% | 11.37% | 12.50% |
| Income Tax Expense | 2.69B | 5.59B | 2.07B | -603.00M | 1.31B | 1.31B | 634.00M | -47.00M | -654.00M | 264.00M | 561.43M | 1.07B | 627.78M | 746.51M | 464.90M | 780.13M | 569.34M | 506.28M | 487.81M |
| Net Income | 1.55B | 5.18B | 2.19B | 1.34B | 1.68B | 1.44B | 435.00M | -301.00M | -1.06B | 394.00M | 1.16B | 1.36B | 1.57B | 920.59M | 571.71M | 1.37B | 1.58B | 1.38B | 1.26B |
| Net Income Ratio | 4.02% | 8.31% | 6.15% | 8.11% | 7.15% | 6.27% | 2.15% | -1.56% | -4.70% | 1.10% | 2.74% | 3.20% | 4.62% | 3.95% | 3.19% | 5.38% | 7.88% | 7.29% | 8.06% |
| EPS | 4.31 | 15.83 | 6.40 | 3.85 | 5.14 | 4.40 | 1.33 | -0.92 | -3.24 | 1.21 | 3.56 | 4.18 | 5.00 | 3.08 | 1.91 | 4.60 | 5.29 | 4.64 | 4.21 |
| EPS Diluted | 4.52 | 15.82 | 6.40 | 3.85 | 5.13 | 4.40 | 1.33 | -0.92 | -3.24 | 1.20 | 3.55 | 4.17 | 4.99 | 3.07 | 1.91 | 4.60 | 5.28 | 4.44 | 4.00 |
| Weighted Avg Shares Out | 343.36M | 326.90M | 326.85M | 326.83M | 326.61M | 326.65M | 326.65M | 326.42M | 326.33M | 326.25M | 326.22M | 326.14M | 314.19M | 298.78M | 298.76M | 298.75M | 298.65M | 298.23M | 298.67M |
| Weighted Avg Shares Out (Dil) | 327.17M | 327.14M | 327.27M | 326.99M | 326.86M | 327.15M | 327.27M | 327.07M | 326.64M | 327.27M | 327.27M | 327.16M | 315.39M | 299.73M | 299.02M | 298.91M | 299.19M | 312.25M | 317.23M |

OMV Aktiengesellschaft (OMVJF) Q2 2023 Earnings Call Transcript

OMV: Reiterating The Buy Recommendation

OMV: Attractive Dividend Yield While We Wait For Multiples To Re-Rate

OMV Aktiengesellschaft (OMVJF) Q1 2023 Earnings Call Transcript

Thoughts on Europe's Big Oil

OMV: Double-Digit Dividend Yield And Better Financials Than Larger Peers

OMV AG (OMVJF) Q4 2022 Earnings Call Transcript

Are Investors Undervaluing OMV (OMVJF) Right Now?

OMV AG (OMVJF) Upgraded to Strong Buy: Here's What You Should Know

Should Value Investors Buy OMV (OMVJF) Stock?
Source: https://incomestatements.info
Category: Stock Reports
