See more : Spod Lithium Corp. (SPOD.CN) Income Statement Analysis – Financial Results
Complete financial analysis of Ocean Power Technologies, Inc. (OPTT) income statement, including revenue, profit margins, EPS and key performance metrics. Get detailed insights into the financial performance of Ocean Power Technologies, Inc., a leading company in the Electrical Equipment & Parts industry within the Industrials sector.
- Engie SA (ENGQF) Income Statement Analysis – Financial Results
- Gaming Corps AB (publ) (GCOR.ST) Income Statement Analysis – Financial Results
- Nectar Lifesciences Limited (NECLIFE.NS) Income Statement Analysis – Financial Results
- Randgold & Exploration Company Limited (RNG.JO) Income Statement Analysis – Financial Results
- Kardemir Karabük Demir Çelik Sanayi Ve Ticaret A.S. (KRDMD.IS) Income Statement Analysis – Financial Results
Ocean Power Technologies, Inc. (OPTT)
Industry: Electrical Equipment & Parts
Sector: Industrials
About Ocean Power Technologies, Inc.
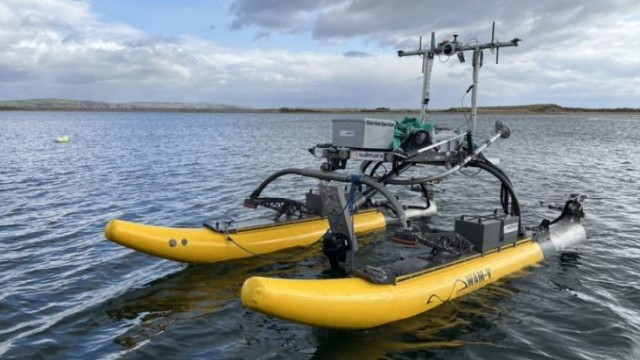
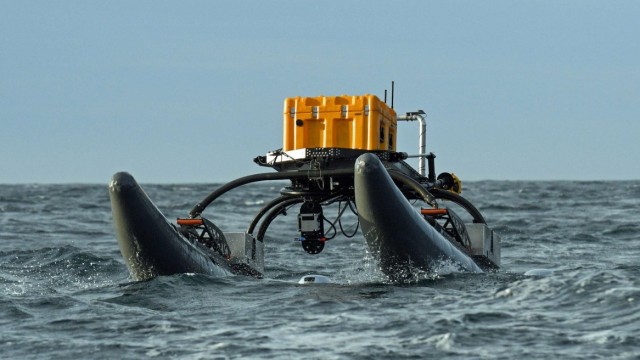
Ocean Power Technologies, Inc. develops and commercializes proprietary systems that generate electricity by harnessing the renewable energy of ocean waves in North America, South America, Europe, and Asia. It offers PB3 PowerBuoy system that generates power for use independent of the power grid in offshore locations. The company also provides hybrid PowerBuoy products; subsea battery systems; and software, controls, sensors, integration services, and marine installation services. In addition, it offers distributed offshore power and communications for remote surface and subsea applications in markets, such as defense and security, offshore oil and gas, science and research, and offshore wind. Further, the company provides Wave Adaptive Modular Vessel (WAM-V) technology, which enables roaming capabilities for uncrewed maritime systems in waters; leases WAM-V robotics and access information; maritime domain awareness solutions; and strategic consulting services. Additionally, it offers offshore data collection, integration, analytics, and real time communication for various applications. The company serves public and private entities, and agencies that require remote offshore power. Ocean Power Technologies, Inc. was incorporated in 1984 and is headquartered in Monroe Township, New Jersey.
| Metric | 2024 | 2023 | 2022 | 2021 | 2020 | 2019 | 2018 | 2017 | 2016 | 2015 | 2014 | 2013 | 2012 | 2011 | 2010 | 2009 | 2008 | 2007 | 2006 | 2005 | 2004 | 2003 |
|---|---|---|---|---|---|---|---|---|---|---|---|---|---|---|---|---|---|---|---|---|---|---|
| Revenue | 5.53M | 2.73M | 1.76M | 1.21M | 1.68M | 632.00K | 511.00K | 843.00K | 704.82K | 4.11M | 1.50M | 3.62M | 5.74M | 6.69M | 5.10M | 4.05M | 4.77M | 2.53M | 1.75M | 5.37M | 4.71M | 2.55M |
| Cost of Revenue | 2.70M | 2.50M | 1.86M | 2.28M | 1.79M | 1.30M | 763.00K | 938.00K | 667.87K | 4.67M | 1.51M | 3.48M | 5.68M | 6.26M | 4.30M | 4.84M | 7.96M | 3.98M | 2.06M | 5.17M | 4.32M | 2.56M |
| Gross Profit | 2.83M | 236.00K | -101.00K | -1.07M | -105.00K | -671.00K | -252.00K | -95.00K | 36.95K | -565.98K | -11.44K | 135.31K | 54.78K | 435.65K | 802.36K | -790.96K | -3.19M | -1.45M | -311.60K | 194.71K | 393.35K | -6.97K |
| Gross Profit Ratio | 51.15% | 8.64% | -5.74% | -88.97% | -6.24% | -106.17% | -49.32% | -11.27% | 5.24% | -13.79% | -0.76% | 3.74% | 0.95% | 6.51% | 15.73% | -19.53% | -66.81% | -57.38% | -17.83% | 3.63% | 8.35% | -0.27% |
| Research & Development | 0.00 | 0.00 | 9.61M | 4.75M | 4.34M | 4.98M | 4.32M | 5.03M | 7.05M | 4.15M | 4.56M | 7.33M | 8.34M | 13.32M | 13.00M | 8.37M | 8.26M | 6.22M | 4.22M | 904.62K | 0.00 | 180.40K |
| General & Administrative | 0.00 | 0.00 | 0.00 | 0.00 | 0.00 | 0.00 | 6.99M | 6.56M | 6.75M | 9.57M | 9.36M | 9.13M | 8.27M | 8.40M | 9.06M | 9.53M | 7.73M | 0.00 | 0.00 | 0.00 | 0.00 | 0.00 |
| Selling & Marketing | 0.00 | 0.00 | 0.00 | 0.00 | 0.00 | 0.00 | 0.00 | 0.00 | 0.00 | 0.00 | 0.00 | 0.00 | 0.00 | 0.00 | 0.00 | 0.00 | 0.00 | 0.00 | 0.00 | 0.00 | 0.00 | 0.00 |
| SG&A | 32.23M | 28.34M | 11.91M | 7.77M | 6.92M | 7.62M | 6.99M | 6.56M | 6.75M | 9.57M | 9.36M | 9.13M | 8.27M | 8.40M | 9.06M | 9.53M | 7.73M | 4.89M | 3.19M | 2.55M | 1.75M | 818.60K |
| Other Expenses | 0.00 | 28.34M | 60.00K | -83.00K | 0.00 | 0.00 | 4.00K | 0.00 | 240.64K | 419.43K | 0.00 | 0.00 | 0.00 | 0.00 | 0.00 | 0.00 | 0.00 | 0.00 | 0.00 | 0.00 | 255.96K | 0.00 |
| Operating Expenses | 32.23M | 28.34M | 21.51M | 12.52M | 11.26M | 12.60M | 11.31M | 11.59M | 13.80M | 13.72M | 13.92M | 16.45M | 16.61M | 21.72M | 22.07M | 17.90M | 15.99M | 11.11M | 7.42M | 3.46M | 2.00M | 999.00K |
| Cost & Expenses | 34.93M | 30.84M | 23.37M | 14.80M | 13.05M | 13.90M | 12.07M | 12.53M | 14.47M | 18.39M | 15.43M | 19.94M | 22.30M | 27.97M | 26.36M | 22.74M | 23.95M | 15.10M | 9.48M | 8.63M | 6.32M | 3.55M |
| Interest Income | 800.00K | 902.00K | 124.00K | 124.00K | 124.00K | 35.00K | 83.00K | 28.00K | 7.54K | 0.00 | 0.00 | 126.38K | 418.05K | 0.00 | 0.00 | 0.00 | 0.00 | 0.00 | 0.00 | 0.00 | 0.00 | 0.00 |
| Interest Expense | 0.00 | 0.00 | 124.00K | 0.00 | 0.00 | 0.00 | 0.00 | 0.00 | 7.54K | 31.63K | 0.00 | 0.00 | 0.00 | 0.00 | 0.00 | 0.00 | 0.00 | 0.00 | 0.00 | 0.00 | 0.00 | 0.00 |
| Depreciation & Amortization | 1.16M | 637.00K | 515.00K | 372.00K | 355.00K | 180.00K | 122.00K | 140.00K | 111.71K | 965.16K | 421.84K | 502.10K | 436.06K | 358.72K | 365.76K | 299.41K | 241.72K | 269.08K | 233.13K | 140.98K | 0.00 | -473.00 |
| EBITDA | -28.24M | -27.76M | -21.10M | -13.44M | -10.89M | -13.09M | -11.44M | -11.55M | -13.65M | -13.32M | -12.52M | -15.82M | -16.12M | -20.92M | -21.26M | -18.39M | -19.18M | -12.57M | -7.49M | -3.12M | -1.61M | -1.01M |
| EBITDA Ratio | -511.17% | -1,045.50% | -1,241.05% | -995.94% | -654.22% | -2,093.51% | -2,276.91% | -1,544.72% | -1,759.94% | -313.21% | -966.19% | -435.10% | -279.10% | -309.29% | -431.17% | -422.22% | -398.54% | -546.52% | -377.08% | -86.32% | -34.13% | -39.49% |
| Operating Income | -29.40M | -29.22M | -21.61M | -13.59M | -11.37M | -13.27M | -11.56M | -11.69M | -14.86M | -14.29M | -13.15M | -16.32M | -16.56M | -21.28M | -21.26M | -18.69M | -19.18M | -12.57M | -7.73M | -3.26M | -1.61M | -1.01M |
| Operating Income Ratio | -532.18% | -1,069.40% | -1,228.71% | -1,127.03% | -675.68% | -2,099.84% | -2,262.23% | -1,386.36% | -2,108.05% | -347.99% | -877.34% | -451.29% | -288.52% | -318.08% | -416.81% | -461.60% | -401.84% | -496.42% | -442.14% | -60.83% | -34.13% | -39.48% |
| Total Other Income/Expenses | 666.00K | 2.61M | 856.00K | -1.17M | 118.00K | 175.00K | 284.00K | 1.50M | -568.36K | -74.98K | 213.36K | 42.96K | 313.31K | 459.86K | 2.13M | 377.12K | 4.52M | 2.93M | 504.41K | 2.81M | -1.36M | 38.91K |
| Income Before Tax | -28.74M | -26.60M | -20.70M | -14.76M | -11.25M | -13.10M | -11.28M | -10.18M | -14.76M | -14.36M | -12.94M | -16.28M | -16.24M | -20.82M | -19.13M | -18.32M | -14.66M | -9.64M | -7.22M | -457.97K | -2.97M | -967.06K |
| Income Before Tax Ratio | -520.13% | -973.79% | -1,176.63% | -1,223.88% | -668.67% | -2,072.15% | -2,206.65% | -1,208.07% | -2,093.94% | -349.82% | -863.10% | -450.10% | -283.06% | -311.20% | -375.04% | -452.29% | -307.14% | -380.78% | -413.28% | -8.54% | -62.96% | -37.95% |
| Income Tax Expense | -1.25M | -278.00K | -1.82M | 1.09M | -895.00K | -850.00K | -1.12M | -698.00K | -1.67M | -1.14M | -1.75M | -1.45M | -1.05M | -364.11K | 38.30K | -377.12K | -4.52M | -2.93M | -143.96K | -29.34K | -118.12K | -146.85K |
| Net Income | -27.48M | -26.33M | -18.87M | -15.85M | -10.35M | -12.25M | -10.16M | -9.49M | -13.13M | -13.11M | -10.97M | -14.68M | -15.14M | -20.44M | -19.17M | -18.32M | -14.66M | -9.64M | -7.08M | -428.63K | -2.85M | -820.21K |
| Net Income Ratio | -497.43% | -963.62% | -1,073.00% | -1,313.85% | -615.46% | -1,937.66% | -1,987.67% | -1,125.27% | -1,862.74% | -319.44% | -731.82% | -406.01% | -263.84% | -305.42% | -375.79% | -452.29% | -307.14% | -380.78% | -405.04% | -7.99% | -60.46% | -32.19% |
| EPS | -0.47 | -0.47 | -0.35 | -0.53 | -1.44 | -9.52 | -13.24 | -44.54 | -145.06 | -149.96 | -182.19 | -284.97 | -294.63 | -398.87 | -375.26 | -358.76 | -287.37 | -62.26 | -27.48 | -16.69 | -141.15 | -54.37 |
| EPS Diluted | -0.47 | -0.47 | -0.35 | -0.53 | -1.44 | -9.52 | -13.24 | -44.54 | -145.06 | -149.96 | -182.19 | -284.97 | -294.63 | -398.87 | -375.26 | -358.76 | -287.37 | -62.26 | -27.48 | -16.69 | -141.15 | -54.37 |
| Weighted Avg Shares Out | 59.03M | 56.00M | 54.01M | 30.02M | 7.21M | 1.29M | 767.33K | 212.96K | 90.51K | 87.45K | 60.21K | 51.52K | 51.39K | 51.23K | 51.09K | 51.05K | 51.00K | 154.81K | 257.60K | 25.68K | 20.19K | 15.09K |
| Weighted Avg Shares Out (Dil) | 59.03M | 56.00M | 54.01M | 30.02M | 7.21M | 1.29M | 767.33K | 212.96K | 90.51K | 87.45K | 60.21K | 51.52K | 51.39K | 51.23K | 51.09K | 51.05K | 51.00K | 154.81K | 257.60K | 25.68K | 20.19K | 15.09K |

Ocean Power Technologies Signs OEM Agreement with Key Maritime Technology Provider Teledyne Marine

Why Is Ocean Power Technologies (OPTT) Stock Up 60% Today?

Ocean Power stock soars after WAM-V deal with the US government

Ocean Power Technologies unveils contract to deliver multiple WAM-Vs to US government department

Ocean Power Technologies named preferred supplier for Merrow buoy in the Middle East

Ocean Power Technologies expands services with new 24/7 global support offering

Ocean Power Technologies Launches Global 24/7 Service Support Offering

Ocean Power Technologies delivers first unmanned surface vehicles to Sulmara

Ocean Power Fails to Engage in Good Faith with Paragon Creating Going Concern Issues and Risk for the Company and Its Shareholders

Ocean Power Technologies wins contract for unmanned surface vehicle with offshore construction contractor
Source: https://incomestatements.info
Category: Stock Reports
