See more : COOCON Corporation (294570.KQ) Income Statement Analysis – Financial Results
Complete financial analysis of Oatly Group AB (OTLY) income statement, including revenue, profit margins, EPS and key performance metrics. Get detailed insights into the financial performance of Oatly Group AB, a leading company in the Beverages – Non-Alcoholic industry within the Consumer Defensive sector.
- American Electric Power Company, Inc. (0HEC.L) Income Statement Analysis – Financial Results
- GSL Securities Limited (GSLSEC.BO) Income Statement Analysis – Financial Results
- Nautilus, Inc. (NLS) Income Statement Analysis – Financial Results
- InVivo Therapeutics Holdings Corporation (NVIV) Income Statement Analysis – Financial Results
- Pfizer Limited (PFIZER.BO) Income Statement Analysis – Financial Results
Oatly Group AB (OTLY)
About Oatly Group AB
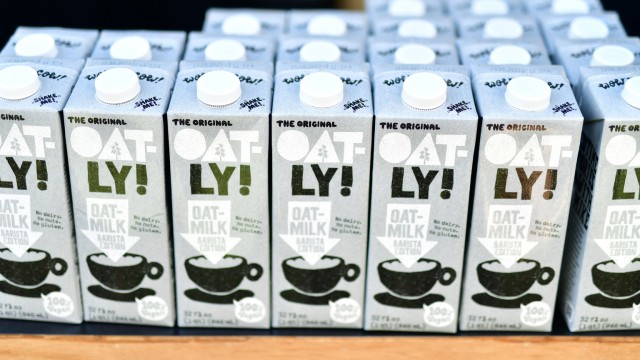
Oatly Group AB, an oatmilk company, provides a range of plant-based dairy products made from oats in Sweden. It offers Barista edition oatmilk, oatgurts, frozen desserts, ice-creams, and yogurts; ready-to-go drinks, such as cold brew latte, mocha latte, matcha latte, and mini oat drink in original and chocolate flavors; and cooking products, including Cooking Cream, in regular and organic, Crème Fraiche, Whipping Cream, Vanilla Custard and Spreads in a variety of flavors. The company was formerly known as Havre Global AB and changed its name to Oatly Group AB in March 2021. The company was founded in 1994 and is headquartered in Malmö, Sweden.
| Metric | 2023 | 2022 | 2021 | 2020 | 2019 |
|---|---|---|---|---|---|
| Revenue | 783.35M | 722.24M | 643.19M | 421.35M | 204.05M |
| Cost of Revenue | 631.27M | 642.21M | 488.18M | 292.11M | 137.46M |
| Gross Profit | 152.08M | 80.03M | 155.01M | 129.24M | 66.59M |
| Gross Profit Ratio | 19.41% | 11.08% | 24.10% | 30.67% | 32.63% |
| Research & Development | 21.05M | 22.26M | 16.77M | 6.83M | 4.31M |
| General & Administrative | 0.00 | 0.00 | 0.00 | 0.00 | 0.00 |
| Selling & Marketing | 0.00 | 0.00 | 0.00 | 0.00 | 0.00 |
| SG&A | 373.40M | 412.80M | 353.93M | 167.79M | 93.44M |
| Other Expenses | 214.65M | 40.95M | -1.94M | 1.71M | -409.00K |
| Operating Expenses | 609.10M | 476.01M | 368.76M | 176.34M | 97.34M |
| Cost & Expenses | 1.24B | 1.12B | 856.93M | 468.44M | 234.81M |
| Interest Income | 12.67M | 2.14M | 1.77M | 119.00K | 47.00K |
| Interest Expense | 69.16M | 1.41M | 14.98M | 11.87M | 2.50M |
| Depreciation & Amortization | 51.97M | 48.56M | 26.70M | 13.25M | 8.09M |
| EBITDA | -287.79M | -355.03M | -172.15M | -34.33M | -23.73M |
| EBITDA Ratio | -36.74% | -48.14% | -29.00% | -8.15% | -11.16% |
| Operating Income | -457.01M | -395.99M | -213.74M | -47.09M | -30.76M |
| Operating Income Ratio | -58.34% | -54.83% | -33.23% | -11.18% | -15.07% |
| Total Other Income/Expenses | 48.85M | -1.41M | -1.31M | -10.86M | -3.61M |
| Income Before Tax | -408.17M | -397.39M | -215.05M | -57.95M | -34.37M |
| Income Before Tax Ratio | -52.11% | -55.02% | -33.43% | -13.75% | -16.84% |
| Income Tax Expense | 8.90M | -4.83M | -2.66M | 2.41M | 1.26M |
| Net Income | -416.87M | -392.57M | -212.39M | -60.36M | -35.63M |
| Net Income Ratio | -53.22% | -54.35% | -33.02% | -14.33% | -17.46% |
| EPS | -0.70 | -0.66 | -0.39 | -0.10 | -0.06 |
| EPS Diluted | -0.70 | -0.66 | -0.39 | -0.10 | -0.06 |
| Weighted Avg Shares Out | 593.60M | 592.03M | 549.08M | 591.84M | 591.84M |
| Weighted Avg Shares Out (Dil) | 593.60M | 592.03M | 549.08M | 591.84M | 591.84M |

Oatly to Report Third Quarter 2023 Financial Results on November 9, 2023

Oatly Announces Entry Into Meijer Stores

The 3 Most Undervalued Small-Cap Stocks to Buy Now: August 2023

Oatly Expands Partnership With Deutsche Bahn to Bring Oatly Soft Serve to All Its Lounges Across Germany

Oatly: Running Out Of Runway

Oatly and Amazon Expand Relationship to Meet Growing Demand for Plant-Based Drinks Across Europe

Oatly Stock Is Running Out of Time

Oatly Group: Sour Milk

Why Oatly Stock Plunged by More Than 20% on Thursday

Oatly Reports Second Quarter 2023 Financial Results
Source: https://incomestatements.info
Category: Stock Reports
