See more : AgriFORCE Growing Systems Ltd. (AGRIW) Income Statement Analysis – Financial Results
Complete financial analysis of Oxford Lane Capital Corp. (OXLCP) income statement, including revenue, profit margins, EPS and key performance metrics. Get detailed insights into the financial performance of Oxford Lane Capital Corp., a leading company in the Asset Management industry within the Financial Services sector.
- The Kroger Co. (0JS2.L) Income Statement Analysis – Financial Results
- PTT Oil and Retail Business Public Company Limited (OR.BK) Income Statement Analysis – Financial Results
- Spyre Therapeutics, Inc. (SYRE) Income Statement Analysis – Financial Results
- NanoSphere Health Sciences Inc. (NSHSF) Income Statement Analysis – Financial Results
- The GPT Group (GPTGF) Income Statement Analysis – Financial Results
Oxford Lane Capital Corp. (OXLCP)
About Oxford Lane Capital Corp.
Oxford Lane Capital Corp. is a close ended fund launched and managed by Oxford Lane Management LLC. It invests in fixed income securities. The fund primarily invests in securitization vehicles which in turn invest in senior secured loans made to companies whose debt is rated below investment grade or is unrated. Oxford Lane Capital Corp was formed on June 9, 2010 and is domiciled in the United States.
| Metric | 2023 | 2022 | 2021 | 2020 | 2019 | 2018 | 2017 | 2016 | 2015 | 2014 | 2013 | 2012 | 2011 | 2010 |
|---|---|---|---|---|---|---|---|---|---|---|---|---|---|---|
| Revenue | 290.64M | -158.43M | 130.15M | 293.35M | -288.16M | -18.57M | 40.42M | 107.41M | -83.46M | 5.95M | 25.25M | 11.60M | 5.01M | 520.00K |
| Cost of Revenue | 77.49M | 65.59M | 54.45M | 32.12M | 31.63M | 23.62M | 19.38M | 14.59M | 15.10M | 0.00 | 0.00 | 3.87M | 1.21M | 140.00K |
| Gross Profit | 213.15M | -224.02M | 75.69M | 261.23M | -319.79M | -42.20M | 21.04M | 92.82M | -98.56M | 5.95M | 25.25M | 7.73M | 3.80M | 380.00K |
| Gross Profit Ratio | 73.34% | 141.40% | 58.16% | 89.05% | 110.98% | 227.20% | 52.05% | 86.42% | 118.09% | 100.00% | 100.00% | 66.64% | 75.85% | 73.08% |
| Research & Development | 0.00 | 0.00 | 0.00 | 0.00 | 0.00 | 0.00 | 0.00 | 0.00 | 0.00 | 0.00 | 0.00 | 0.00 | 0.00 | 0.00 |
| General & Administrative | 5.33M | 4.45M | 3.91M | 3.22M | 2.80M | 2.27M | 2.28M | 2.10M | 2.23M | 2.51M | 2.52M | 1.80M | 1.17M | 260.00K |
| Selling & Marketing | 0.00 | 0.00 | 0.00 | 0.00 | 0.00 | 0.00 | 0.00 | 0.00 | 0.00 | 0.00 | 0.00 | 0.00 | 0.00 | 0.00 |
| SG&A | 5.33M | 4.45M | 3.91M | 3.22M | 2.80M | 2.27M | 2.28M | 2.10M | 2.23M | 2.51M | 2.52M | 1.80M | 1.17M | 260.00K |
| Other Expenses | 0.00 | -315.74M | 361.97K | 201.41K | 176.24K | 140.67K | 136.90K | 108.62K | 83.59K | 109.11K | 69.76K | 0.00 | 0.00 | -10.00K |
| Operating Expenses | 11.55M | 12.86M | 4.27M | 3.42M | 2.97M | 2.41M | 2.42M | 2.21M | 2.32M | 2.62M | 2.59M | 1.80M | 1.17M | 250.00K |
| Cost & Expenses | 22.68M | 12.86M | 4.27M | 3.42M | 2.97M | 2.41M | 2.42M | 2.21M | 2.32M | 2.62M | 2.59M | 5.67M | 2.38M | 390.00K |
| Interest Income | 15.31M | 7.25M | 3.95M | 6.12M | 3.74M | 1.40M | 1.60M | 1.05M | 1.04M | 1.45M | 23.01M | 0.00 | 0.00 | 0.00 |
| Interest Expense | 32.86M | 31.81M | 22.08M | 16.28M | 15.48M | 15.05M | 13.40M | 11.71M | 14.81M | 10.66M | 4.50M | 18.39M | 1.79M | 0.00 |
| Depreciation & Amortization | 1.00 | 228.49K | 236.56K | 206.30K | 171.86K | 161.14K | 52.52K | 22.82K | 14.81M | 10.66M | 4.50M | 36.78M | 3.58M | -80.00K |
| EBITDA | 267.96M | -171.29M | 147.96M | 306.21M | -275.65M | 0.00 | 39.72M | 116.91M | -70.97M | 13.99M | 27.16M | 42.70M | 6.21M | 40.00K |
| EBITDA Ratio | 92.20% | 108.11% | 113.68% | 104.38% | 95.66% | 31.93% | 127.17% | 108.85% | 85.03% | 235.18% | 107.55% | 368.10% | 123.95% | 7.69% |
| Operating Income | 267.96M | -171.29M | 147.96M | 306.21M | -275.65M | -5.93M | 51.41M | 116.91M | -85.78M | 3.33M | 22.66M | 5.92M | 2.63M | 120.00K |
| Operating Income Ratio | 92.20% | 108.11% | 113.68% | 104.38% | 95.66% | 31.93% | 127.17% | 108.85% | 102.77% | 56.00% | 89.73% | 51.03% | 52.50% | 23.08% |
| Total Other Income/Expenses | -32.86M | -31.81M | -22.08M | -16.28M | -15.48M | 0.00 | -1.71M | 14.59M | 0.00 | 0.00 | 0.00 | 18.39M | 1.79M | -40.00K |
| Income Before Tax | 235.11M | -171.29M | 125.88M | 289.93M | -291.13M | -20.98M | 38.01M | 105.20M | -85.78M | 3.33M | 22.66M | 24.31M | 4.42M | 80.00K |
| Income Before Tax Ratio | 80.89% | 108.11% | 96.72% | 98.83% | 101.03% | 112.97% | 94.02% | 97.94% | 102.77% | 56.00% | 89.73% | 209.57% | 88.22% | 15.38% |
| Income Tax Expense | 0.00 | -32.03M | -236.56K | -206.30K | -171.86K | -161.14K | -52.52K | -22.82K | -14.81M | 0.00 | 0.00 | 0.00 | 0.00 | 0.00 |
| Net Income | 235.11M | -171.29M | 125.88M | 289.93M | -291.13M | -20.98M | 38.01M | 105.20M | -85.78M | 3.33M | 22.66M | 24.31M | 4.42M | 80.00K |
| Net Income Ratio | 80.89% | 108.11% | 96.72% | 98.83% | 101.03% | 112.97% | 94.02% | 97.94% | 102.77% | 56.00% | 89.73% | 209.57% | 88.22% | 15.38% |
| EPS | 1.12 | -1.14 | 1.20 | 3.14 | -4.14 | -0.51 | 1.49 | 5.41 | -4.64 | 0.23 | 1.49 | 1.55 | 0.28 | 0.01 |
| EPS Diluted | 1.12 | -1.14 | 1.20 | 3.14 | -4.14 | -0.51 | 1.49 | 5.41 | -4.64 | 0.23 | 1.49 | 1.55 | 0.28 | 0.01 |
| Weighted Avg Shares Out | 209.92M | 150.25M | 104.90M | 92.34M | 70.32M | 41.14M | 25.51M | 19.45M | 18.49M | 14.48M | 15.24M | 15.70M | 15.70M | 15.70M |
| Weighted Avg Shares Out (Dil) | 209.92M | 150.25M | 104.90M | 92.34M | 70.32M | 41.14M | 25.51M | 19.45M | 18.49M | 14.48M | 15.24M | 15.70M | 15.70M | 15.70M |
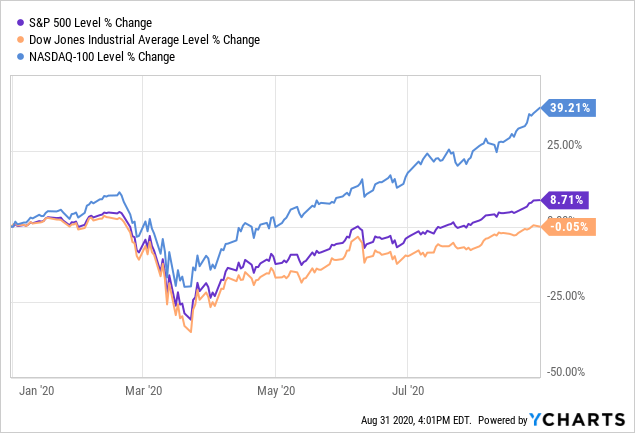
4 Funds Bought In August, Mixture Of Opportunity And Speculation
The Chemist's Quality Closed-End Fund Report: August 2020
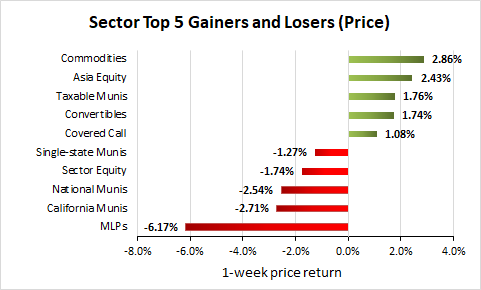
Weekly Closed-End Fund Roundup: August 30, 2020
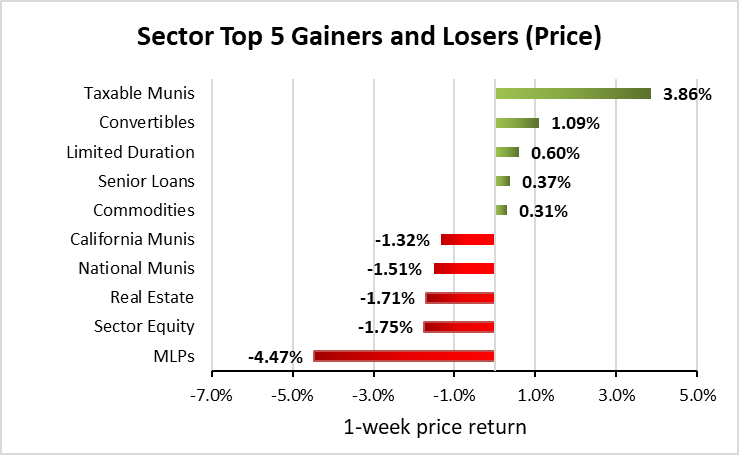
Weekly Closed-End Fund Roundup: August 23, 2020
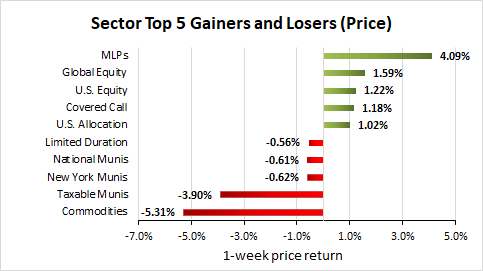
Weekly Closed-End Fund Roundup: MAV Boosts Again (August 16, 2020)
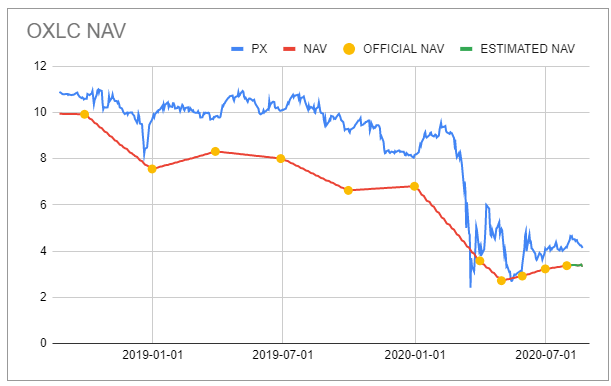
What We Hold Across The CLO Equity Capital Structures

The Retiree's Dividend Portfolio - Jane's July Update: Resilient Dividends
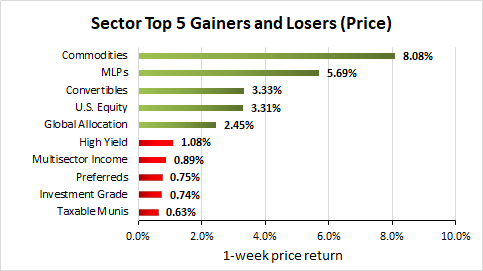
Weekly Closed-End Fund Roundup: August 9, 2020

Oxford Lane Capital Corp. (OXLC) CEO Jonathan Cohen on Q1 2021 Results - Earnings Call Transcript
The Chemist's Closed-End Fund Report: July 2020
Source: https://incomestatements.info
Category: Stock Reports
