See more : HLB Co., Ltd. (028300.KQ) Income Statement Analysis – Financial Results
Complete financial analysis of Pangaea Logistics Solutions, Ltd. (PANL) income statement, including revenue, profit margins, EPS and key performance metrics. Get detailed insights into the financial performance of Pangaea Logistics Solutions, Ltd., a leading company in the Marine Shipping industry within the Industrials sector.
- Murphy Oil Corporation (0K3S.L) Income Statement Analysis – Financial Results
- Freegold Ventures Limited (FVL.TO) Income Statement Analysis – Financial Results
- Emkay Global Financial Services Limited (EMKAY.NS) Income Statement Analysis – Financial Results
- Atlanta Gold Inc. (ATLDF) Income Statement Analysis – Financial Results
- Yum! Brands, Inc. (0QYD.L) Income Statement Analysis – Financial Results
Pangaea Logistics Solutions, Ltd. (PANL)
About Pangaea Logistics Solutions, Ltd.
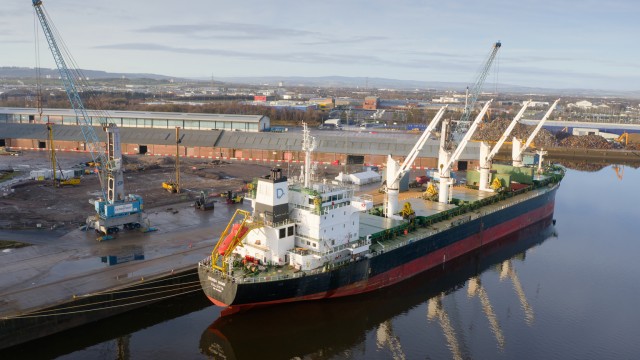
Pangaea Logistics Solutions, Ltd., together with its subsidiaries, provides seaborne dry bulk logistics and transportation services to industrial customers worldwide. The company offers various dry bulk cargoes, such as grains, coal, iron ore, pig iron, hot briquetted iron, bauxite, alumina, cement clinker, dolomite, and limestone. Its ocean logistics services comprise cargo loading, cargo discharge, vessel chartering, voyage planning, and technical vessel management. As of March 16, 2022, the company owned and operated a fleet of 25 vessels. Pangaea Logistics Solutions, Ltd. was founded in 1996 and is based in Newport, Rhode Island.
| Metric | 2023 | 2022 | 2021 | 2020 | 2019 | 2018 | 2017 | 2016 | 2015 | 2014 | 2013 | 2012 |
|---|---|---|---|---|---|---|---|---|---|---|---|---|
| Revenue | 499.27M | 699.71M | 718.10M | 382.90M | 412.20M | 372.97M | 385.09M | 238.02M | 287.33M | 398.28M | 392.47M | 387.06M |
| Cost of Revenue | 430.13M | 570.77M | 620.27M | 344.75M | 362.22M | 319.56M | 345.48M | 212.35M | 245.85M | 380.38M | 359.49M | 349.21M |
| Gross Profit | 69.14M | 128.94M | 97.84M | 38.14M | 49.97M | 53.42M | 39.61M | 25.67M | 41.49M | 17.90M | 32.98M | 37.85M |
| Gross Profit Ratio | 13.85% | 18.43% | 13.62% | 9.96% | 12.12% | 14.32% | 10.29% | 10.78% | 14.44% | 4.49% | 8.40% | 9.78% |
| Research & Development | 0.00 | 0.00 | 0.00 | 0.00 | 0.00 | 0.00 | 0.00 | 0.00 | 0.00 | 0.00 | 0.00 | 0.00 |
| General & Administrative | 22.58M | 20.10M | 18.97M | 15.92M | 17.38M | 16.48M | 15.16M | 12.77M | 14.97M | 12.83M | 11.60M | 11.03M |
| Selling & Marketing | 200.00K | 0.00 | 0.00 | 0.00 | 0.00 | 0.00 | 0.00 | 0.00 | 0.00 | 0.00 | 0.00 | 0.00 |
| SG&A | 22.78M | 20.10M | 18.97M | 15.92M | 17.38M | 16.48M | 15.16M | 12.77M | 14.97M | 12.83M | 11.60M | 11.03M |
| Other Expenses | 1.74M | 807.14K | 1.13M | 982.35K | 314.85K | 677.09K | 1.84M | -158.53K | -926.76K | -3.69M | 45.94K | 0.00 |
| Operating Expenses | 22.78M | 20.10M | 18.97M | 15.92M | 17.38M | 16.48M | 15.16M | 12.77M | 14.97M | 12.83M | 11.60M | 17.41M |
| Cost & Expenses | 454.65M | 590.87M | 639.23M | 360.67M | 379.60M | 336.04M | 360.64M | 225.12M | 260.81M | 393.21M | 371.09M | 366.61M |
| Interest Income | 3.57M | 21.49M | 11.51M | 7.83M | 9.28M | 0.00 | 0.00 | 0.00 | 0.00 | 0.00 | 0.00 | 4.53M |
| Interest Expense | 17.49M | 21.49M | 11.51M | 7.83M | 9.28M | 8.90M | 8.27M | 5.74M | 5.86M | 6.23M | 7.02M | 0.00 |
| Depreciation & Amortization | 30.07M | 29.49M | 22.97M | 17.06M | 18.53M | 17.62M | 15.61M | 14.11M | 12.73M | 11.67M | 9.61M | 6.68M |
| EBITDA | 76.10M | 138.32M | 101.85M | 39.28M | 44.86M | 54.55M | 40.92M | 27.00M | 39.25M | 4.25M | 32.15M | 26.32M |
| EBITDA Ratio | 15.24% | 19.88% | 14.34% | 10.52% | 12.48% | 14.81% | 10.88% | 11.28% | 13.34% | 3.27% | 7.91% | 6.80% |
| Operating Income | 44.62M | 105.51M | 78.87M | 19.70M | 32.91M | 36.07M | 15.17M | 12.89M | 20.53M | -2.49M | 21.38M | 19.64M |
| Operating Income Ratio | 8.94% | 15.08% | 10.98% | 5.14% | 7.98% | 9.67% | 3.94% | 5.42% | 7.14% | -0.63% | 5.45% | 5.08% |
| Total Other Income/Expenses | -15.62M | -20.00M | -6.50M | -7.00M | -6.21M | -12.09M | -6.93M | -3.73M | -7.16M | -11.15M | -5.87M | -3.73M |
| Income Before Tax | 29.00M | 85.51M | 72.37M | 12.69M | 17.05M | 23.98M | 9.10M | 9.16M | 13.37M | -13.65M | 15.51M | 15.91M |
| Income Before Tax Ratio | 5.81% | 12.22% | 10.08% | 3.31% | 4.14% | 6.43% | 2.36% | 3.85% | 4.65% | -3.43% | 3.95% | 4.11% |
| Income Tax Expense | 0.00 | 8.66M | 17.79M | 10.15M | 14.98M | 10.95M | 10.20M | -461.63K | 8.46M | 7.27M | -1.04M | 18.60M |
| Net Income | 26.32M | 79.49M | 67.23M | 2.54M | 2.07M | 17.76M | 7.81M | 7.46M | 11.28M | -12.13M | 15.45M | -2.69M |
| Net Income Ratio | 5.27% | 11.36% | 9.36% | 0.66% | 0.50% | 4.76% | 2.03% | 3.13% | 3.92% | -3.05% | 3.94% | -0.69% |
| EPS | 0.59 | 1.79 | 1.53 | 0.06 | 0.05 | 0.42 | 0.20 | 0.21 | 0.32 | -0.65 | 1.15 | -30.77 |
| EPS Diluted | 0.58 | 1.76 | 1.50 | 0.06 | 0.05 | 0.42 | 0.20 | 0.21 | 0.32 | -0.65 | 1.15 | -30.77 |
| Weighted Avg Shares Out | 44.77M | 44.40M | 44.00M | 43.42M | 42.75M | 42.25M | 38.41M | 35.16M | 34.78M | 18.73M | 13.42M | 87.32K |
| Weighted Avg Shares Out (Dil) | 45.48M | 45.06M | 44.85M | 43.82M | 43.27M | 42.78M | 38.93M | 35.38M | 34.96M | 18.73M | 13.42M | 87.33K |

PANGAEA LOGISTICS SOLUTIONS ANNOUNCES SECOND QUARTER 2023 CONFERENCE CALL DATE

Pangaea Logistics Solutions: New Multi-Year Highs Despite Challenging Market Conditions

Pangaea Logistics (PANL) Moves 7.0% Higher: Will This Strength Last?

Pangaea Logistics: Dividend Trends Point To A Rising Share Price

48 Easy Pickin' Divvy Nifty 51 Stocks To Buy Now

PANGAEA LOGISTICS SOLUTIONS ANNOUNCES FIRST QUARTER 2023 CONFERENCE CALL DATE

Pangaea Logistics Solutions Ltd. Adds Capacity with the Acquisition of Dry Bulk Vessel

PANGAEA LOGISTICS SOLUTIONS ANNOUNCES FOURTH QUARTER AND FULL YEAR 2022 CONFERENCE CALL DATE

7 Dividend-Paying Stocks to Consider

9 January Mighty Divvy Nifty 50 Dogs To Buy Now
Source: https://incomestatements.info
Category: Stock Reports
