Complete financial analysis of Pioneer Bancorp, Inc. (PBFS) income statement, including revenue, profit margins, EPS and key performance metrics. Get detailed insights into the financial performance of Pioneer Bancorp, Inc., a leading company in the Banks – Regional industry within the Financial Services sector.
- PlantX Life Inc. (PLTXF) Income Statement Analysis – Financial Results
- Shelf Drilling, Ltd. (SHLF.OL) Income Statement Analysis – Financial Results
- NRB Bearings Limited (NRBBEARING.NS) Income Statement Analysis – Financial Results
- Pony AI Inc. American Depositary Shares (PONY) Income Statement Analysis – Financial Results
- Monopar Therapeutics Inc. (MNPR) Income Statement Analysis – Financial Results
Pioneer Bancorp, Inc. (PBFS)
About Pioneer Bancorp, Inc.
Pioneer Bancorp, Inc. operates as a holding company for Pioneer Savings Bank that provides various banking products and services in New York. The company accepts various deposit products, such as demand, savings, and money market accounts, as well as certificates of deposit accounts. Its loan products include commercial real estate, commercial and industrial, commercial construction, one- to four-family residential real estate, home equity, and consumer loans; and home equity lines of credit. The company also invests in the U.S. governmental securities, fixed rate collateralized mortgage obligations, mortgage-backed securities, fixed-rate investment grade bonds, and equity securities. In addition, the company offers personal and commercial insurance products, including homeowners, automobile, and comprehensive business insurance; employee benefit products and services, such as group health, dental, disability, and life insurance products, as well as defined contribution, defined benefit administration, and human resource management services; and wealth management services comprising investment advice, retirement income planning, estate planning, business succession, and employer retirement planning. It operates through a network of 22 retail banking offices in Albany, Greene, Rensselaer, Saratoga, Schenectady, and Warren Counties in New York. The company was founded in 1889 and is based in Albany, New York. Pioneer Bancorp, Inc. operates as a subsidiary of Pioneer Bancorp, MHC.
| Metric | 2024 | 2023 | 2022 | 2021 | 2020 | 2019 | 2018 | 2017 |
|---|---|---|---|---|---|---|---|---|
| Revenue | 74.19M | 79.69M | 56.45M | 57.57M | 64.47M | 64.09M | 59.42M | 46.11M |
| Cost of Revenue | 0.00 | 8.66M | 0.00 | 0.00 | 0.00 | 0.00 | 0.00 | 0.00 |
| Gross Profit | 74.19M | 71.03M | 56.45M | 57.57M | 64.47M | 64.09M | 59.42M | 46.11M |
| Gross Profit Ratio | 100.00% | 89.14% | 100.00% | 100.00% | 100.00% | 100.00% | 100.00% | 100.00% |
| Research & Development | 0.00 | 0.00 | 0.00 | 0.00 | 0.00 | 0.00 | 0.00 | 0.00 |
| General & Administrative | 31.23M | 29.19M | 22.41M | 27.35M | 25.10M | 23.32M | 22.46M | 22.03M |
| Selling & Marketing | 729.00K | 825.00K | 520.00K | 618.00K | 678.00K | 925.00K | 732.00K | 669.00K |
| SG&A | 31.96M | 30.01M | 22.93M | 27.97M | 25.78M | 24.25M | 23.19M | 22.70M |
| Other Expenses | 0.00 | -17.16M | -14.37M | -82.88M | -100.05M | -60.01M | -9.18M | -58.05M |
| Operating Expenses | 53.95M | 5.56M | 4.03M | -54.91M | -74.28M | -35.76M | 9.18M | -35.35M |
| Cost & Expenses | 53.95M | 5.56M | 4.03M | -54.91M | -74.28M | -35.76M | 41.48M | -35.35M |
| Interest Income | 88.32M | 71.03M | 43.84M | 43.93M | 53.52M | 54.16M | 46.49M | 37.62M |
| Interest Expense | 21.80M | 5.49M | 1.46M | 2.11M | 4.73M | 4.48M | 2.00K | 2.41M |
| Depreciation & Amortization | 0.00 | 2.70M | 2.76M | 2.86M | 2.91M | 2.81M | 2.64M | 1.96M |
| EBITDA | 0.00 | 30.55M | 16.08M | 0.00 | 0.00 | 0.00 | 20.58M | 11.10M |
| EBITDA Ratio | 0.00% | 34.95% | 31.08% | 9.58% | -10.70% | 48.59% | 34.42% | 27.58% |
| Operating Income | 13.46M | 27.86M | 14.80M | 2.66M | -9.81M | 28.33M | 17.81M | 10.76M |
| Operating Income Ratio | 18.14% | 34.95% | 26.22% | 4.62% | -15.21% | 44.20% | 29.98% | 23.33% |
| Total Other Income/Expenses | 5.95M | 0.00 | 4.10M | -4.49M | -2.53M | -5.08M | -5.52M | -4.95M |
| Income Before Tax | 19.41M | 27.86M | 13.34M | 2.66M | -9.81M | 23.85M | 17.81M | 8.35M |
| Income Before Tax Ratio | 26.16% | 34.95% | 23.63% | 4.62% | -15.21% | 37.21% | 29.97% | 18.10% |
| Income Tax Expense | 4.15M | 5.91M | 3.06M | 1.58M | -3.30M | 4.83M | 6.31M | 2.72M |
| Net Income | 15.26M | 21.95M | 10.28M | 1.08M | -6.51M | 19.02M | 11.50M | 5.63M |
| Net Income Ratio | 20.57% | 27.54% | 18.21% | 1.87% | -10.10% | 29.67% | 19.35% | 12.21% |
| EPS | 0.61 | 0.87 | 0.41 | 0.04 | -0.26 | 0.73 | 0.44 | 0.50 |
| EPS Diluted | 0.61 | 0.87 | 0.41 | 0.04 | -0.26 | 0.73 | 0.44 | 0.50 |
| Weighted Avg Shares Out | 25.19M | 25.17M | 25.13M | 25.07M | 25.01M | 25.98M | 25.98M | 11.17M |
| Weighted Avg Shares Out (Dil) | 25.22M | 25.17M | 25.13M | 25.07M | 25.01M | 25.98M | 25.98M | 11.17M |

Mid-Morning Market Update: Markets Open Higher; Domino's Pizza Earnings Miss Estimates

12 Industrials Stocks Moving In Tuesday's After-Market Session

12 Industrials Stocks Moving In Monday's After-Market Session

Devon Energy: A Bit About The Merger (NYSE:DVN)

Global Wireline Services Market 2020 Research Report with Consumption, Revenue, Opportunities, Market Share and Growth Rate, Covid-19 Impact and Forecast to 2026 | Absolute Reports

Minnesota halts COVID-19 study after reports of intimidation

Comparing Power Assets (OTCMKTS:HGKGY) and Pioneer Power Solutions (OTCMKTS:PPSI)

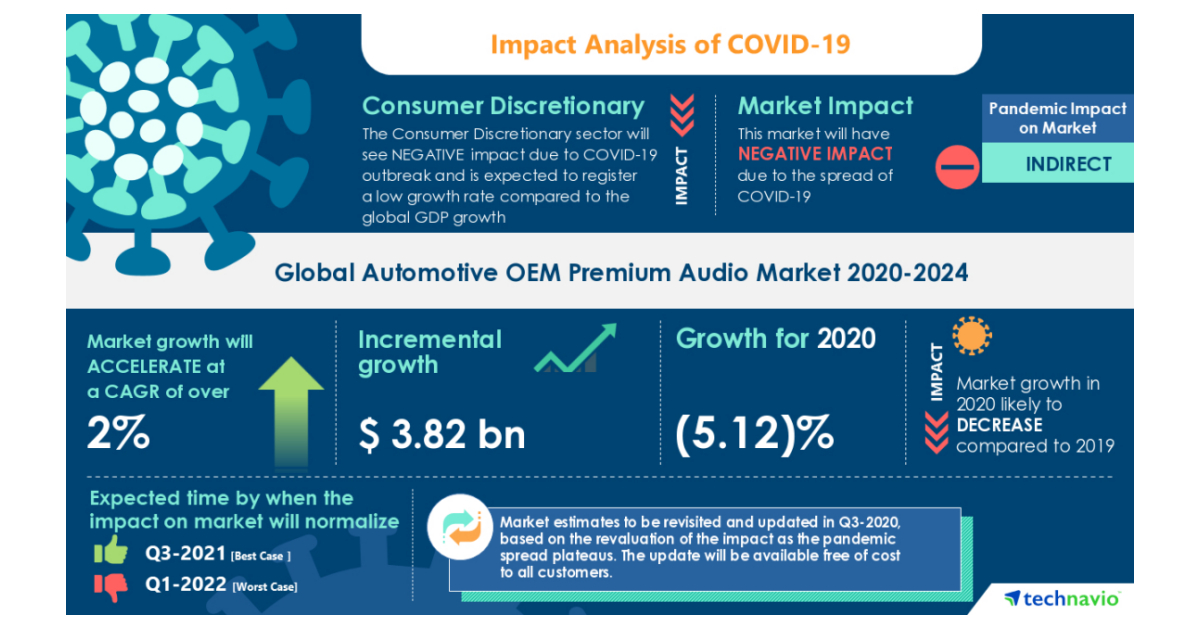
Automotive OEM Premium Audio Market- Roadmap for Recovery from COVID-19 | Rise In HNWI Population to Boost the Market Growth | Technavio

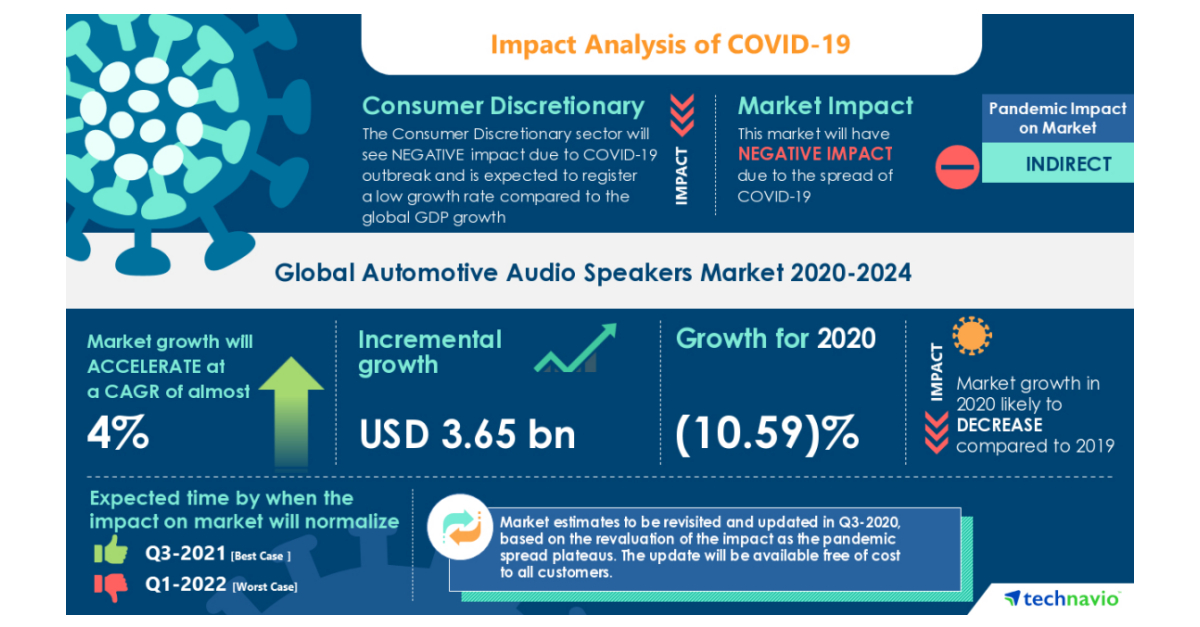
COVID-19 Recovery Analysis: Automotive Audio Speakers Market | Availability of Cost-effective Aftermarket Speakers to boost the Market Growth | Technavio
Source: https://incomestatements.info
Category: Stock Reports

