See more : Hangzhou Raycloud Technology Co., Ltd. (688365.SS) Income Statement Analysis – Financial Results
Complete financial analysis of PBF Logistics LP (PBFX) income statement, including revenue, profit margins, EPS and key performance metrics. Get detailed insights into the financial performance of PBF Logistics LP, a leading company in the Oil & Gas Midstream industry within the Energy sector.
- Bastion Minerals Limited (BMO.AX) Income Statement Analysis – Financial Results
- Hyundai Engineering & Construction Co., Ltd. (000725.KS) Income Statement Analysis – Financial Results
- Critical Elements Lithium Corporation (CRE.V) Income Statement Analysis – Financial Results
- Applied Biosciences Corp. (APPB) Income Statement Analysis – Financial Results
- Sun Communities, Inc. (SUI) Income Statement Analysis – Financial Results
PBF Logistics LP (PBFX)
About PBF Logistics LP
PBF Logistics LP owns, leases, acquires, develops, and operates crude oil and refined petroleum products terminals, pipelines, storage facilities, and other logistics assets in the United States. It operates in two segments, Transportation and Terminaling; and Storage. The company's assets include the DCR rail terminal, a double loop track with ancillary pumping and unloading equipment; the Toledo Truck Terminal, a crude truck unloading terminal; the DCR West Rack, a heavy crude oil rail unloading facility at the Delaware city refinery; and the Toledo storage facility, which includes a propane storage and loading facility. Its assets also comprise the DCR products pipeline, an interstate petroleum products pipeline; the DCR truck rack, a truck loading rack; the San Joaquin Valley pipeline system and Paulsboro natural gas pipeline; the Toledo rail products facility, a loading and unloading rail facility; the Chalmette truck rack, a truck loading rack facility; the Chalmette rosin yard, a rail yard facility; the Paulsboro lube oil terminal, a lube oil terminal facility; and the Delaware ethanol storage facility, an ethanol storage facility. In addition, the company is involved in receiving, handling, storing, and transferring crude oil, refined products, natural gas, and intermediates. PBF Logistics LP was founded in 2012 and is headquartered in Parsippany, New Jersey.
| Metric | 2021 | 2020 | 2019 | 2018 | 2017 | 2016 | 2015 | 2014 | 2013 | 2012 |
|---|---|---|---|---|---|---|---|---|---|---|
| Revenue | 355.54M | 360.26M | 340.21M | 283.44M | 254.81M | 187.34M | 142.10M | 49.83M | 0.00 | 944.00K |
| Cost of Revenue | 37.81M | 53.71M | 38.60M | 29.81M | 23.83M | 14.16M | 6.58M | 3.73M | 1.03M | 944.00K |
| Gross Profit | 317.73M | 306.55M | 301.61M | 253.63M | 230.98M | 173.18M | 135.52M | 46.10M | -1.03M | 0.00 |
| Gross Profit Ratio | 89.37% | 85.09% | 88.65% | 89.48% | 90.65% | 92.44% | 95.37% | 92.51% | 0.00% | 0.00% |
| Research & Development | 0.00 | 0.00 | 0.00 | 0.00 | 0.00 | 0.00 | 0.00 | 0.00 | 0.00 | 0.00 |
| General & Administrative | 18.74M | 18.75M | 24.52M | 21.37M | 16.28M | 16.96M | 13.89M | 7.77M | 1.83M | 665.00K |
| Selling & Marketing | 0.00 | 0.00 | 0.00 | 0.00 | 0.00 | 0.00 | 0.00 | 0.00 | 0.00 | 0.00 |
| SG&A | 18.74M | 18.75M | 24.52M | 21.37M | 16.28M | 16.96M | 13.89M | 7.77M | 1.83M | 665.00K |
| Other Expenses | 103.44M | 99.85M | 118.61M | 88.39M | 66.48M | 44.16M | 25.26M | 22.36M | 6.02M | -9.83M |
| Operating Expenses | 122.17M | 118.60M | 143.13M | 109.76M | 82.77M | 61.12M | 39.14M | 30.13M | 7.86M | -9.17M |
| Cost & Expenses | 159.98M | 172.31M | 181.73M | 139.57M | 106.60M | 75.28M | 45.73M | 33.86M | 8.89M | 9.17M |
| Interest Income | 0.00 | 0.00 | 0.00 | 0.00 | 0.00 | 0.00 | 0.00 | 0.00 | 0.00 | 0.00 |
| Interest Expense | 40.36M | 44.38M | 46.56M | 40.54M | 31.88M | 28.76M | 19.94M | 2.31M | 0.00 | 0.00 |
| Depreciation & Amortization | 37.81M | 53.71M | 38.60M | 29.81M | 23.83M | 14.16M | 6.58M | 3.73M | 1.03M | 944.00K |
| EBITDA | 231.45M | 245.52M | 185.44M | 155.81M | 156.14M | 123.87M | 100.37M | 36.01M | -7.86M | -8.22M |
| EBITDA Ratio | 65.10% | 68.15% | 54.51% | 54.97% | 61.28% | 66.12% | 70.63% | 72.26% | 0.00% | -871.08% |
| Operating Income | 193.64M | 195.34M | 159.27M | 143.87M | 148.22M | 112.06M | 96.38M | 15.97M | -8.89M | -9.17M |
| Operating Income Ratio | 54.46% | 54.22% | 46.82% | 50.76% | 58.17% | 59.82% | 67.82% | 32.05% | 0.00% | -971.08% |
| Total Other Income/Expenses | -42.08M | -47.91M | -51.10M | -43.03M | -33.36M | -30.43M | -21.25M | -2.68M | 0.00 | 0.00 |
| Income Before Tax | 153.29M | 147.43M | 108.17M | 100.84M | 114.85M | 81.62M | 75.12M | 13.29M | -8.89M | -9.17M |
| Income Before Tax Ratio | 43.11% | 40.92% | 31.79% | 35.58% | 45.07% | 43.57% | 52.86% | 26.67% | 0.00% | -971.08% |
| Income Tax Expense | 40.36M | -3.53M | -4.55M | -2.49M | -1.49M | -1.68M | -1.32M | -365.00K | 0.00 | 0.00 |
| Net Income | 112.93M | 147.43M | 100.29M | 85.46M | 100.44M | 80.96M | 73.85M | 29.96M | -8.89M | -9.17M |
| Net Income Ratio | 31.76% | 40.92% | 29.48% | 30.15% | 39.42% | 43.22% | 51.97% | 60.13% | 0.00% | -971.08% |
| EPS | 1.80 | 2.36 | 1.71 | 1.95 | 2.39 | 2.12 | 2.18 | 0.93 | -0.28 | -0.29 |
| EPS Diluted | 1.80 | 2.36 | 1.71 | 1.95 | 2.38 | 2.12 | 2.18 | 0.93 | -0.28 | -0.29 |
| Weighted Avg Shares Out | 62.91M | 62.54M | 58.69M | 43.73M | 42.08M | 38.17M | 33.84M | 32.05M | 31.44M | 31.44M |
| Weighted Avg Shares Out (Dil) | 62.91M | 62.54M | 58.69M | 43.73M | 42.14M | 38.23M | 33.84M | 32.06M | 31.44M | 31.44M |

Arcus Biosciences Announces Second Quarter 2020 Financial Results and Corporate Updates
PBF Logistics (NYSE:PBFX) Rating Lowered to Strong Sell at ValuEngine

PBF Energy (NYSE:PBF) Shares Up 0.9% on Insider Buying Activity
Brokerages Expect PBF Logistics LP (NYSE:PBFX) to Post $0.50 EPS

Phillips 66 And The Future Of Refining (NYSE:PSX)

World Asset Management Inc Increases Holdings in PBF Energy Inc (NYSE:PBF)
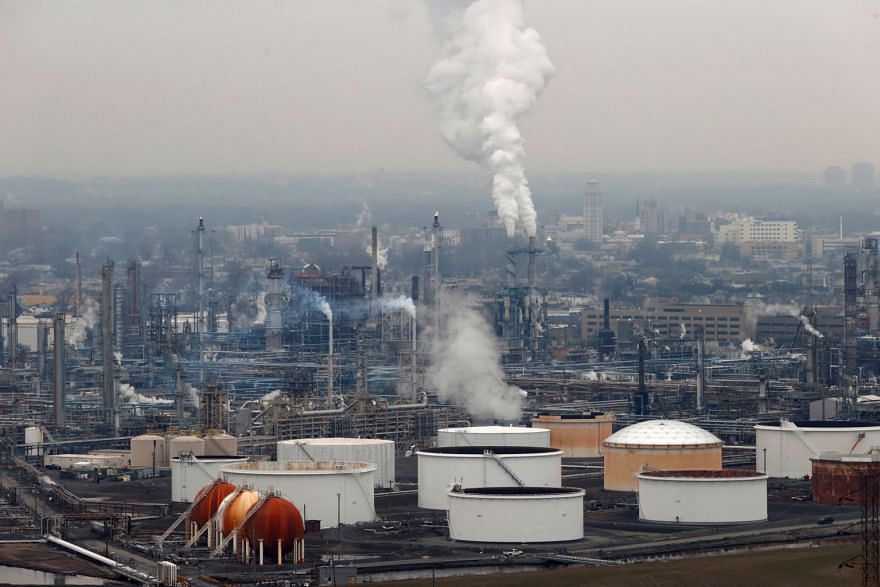
Oil refining capacity may not fully recover from pandemic: executives

PBF Logistics LP (PBFX) Q2 2020 Results - Earnings Call Transcript

Earnings Scheduled For July 31, 2020

Un fallecido en Albacete y 36 nuevos casos de coronavirus
Source: https://incomestatements.info
Category: Stock Reports
