See more : H&K AG (MLHK.PA) Income Statement Analysis – Financial Results
Complete financial analysis of Pernod Ricard SA (PDRDF) income statement, including revenue, profit margins, EPS and key performance metrics. Get detailed insights into the financial performance of Pernod Ricard SA, a leading company in the Beverages – Wineries & Distilleries industry within the Consumer Defensive sector.
- CD Projekt S.A. (OTGLF) Income Statement Analysis – Financial Results
- Advanced Info Service Public Company Limited (AVIVF) Income Statement Analysis – Financial Results
- Rav-Bariach (08) Industries Ltd. (BRIH.TA) Income Statement Analysis – Financial Results
- Avance Technologies Limited (AVANCE.BO) Income Statement Analysis – Financial Results
- Power Nickel Inc. (PNPNF) Income Statement Analysis – Financial Results
Pernod Ricard SA (PDRDF)
Industry: Beverages - Wineries & Distilleries
Sector: Consumer Defensive
Website: https://www.pernod-ricard.com
About Pernod Ricard SA
Pernod Ricard SA produces and sells wines and spirits worldwide. It offers its products under various brands. The company was founded in 1805 and is headquartered in Paris, France.
| Metric | 2024 | 2023 | 2022 | 2021 | 2020 | 2019 | 2018 | 2017 | 2016 | 2015 | 2014 | 2013 | 2012 | 2011 | 2010 | 2009 | 2008 | 2007 | 2006 | 2005 | 2004 | 2003 |
|---|---|---|---|---|---|---|---|---|---|---|---|---|---|---|---|---|---|---|---|---|---|---|
| Revenue | 11.60B | 12.14B | 10.70B | 8.82B | 8.45B | 9.18B | 8.99B | 9.01B | 8.68B | 8.56B | 7.95B | 8.58B | 8.22B | 7.64B | 7.08B | 7.20B | 6.59B | 6.44B | 6.07B | 5.25B | 3.53B | 4.84B |
| Cost of Revenue | 4.62B | 4.89B | 4.23B | 3.53B | 3.36B | 3.53B | 3.38B | 3.41B | 3.31B | 3.26B | 2.96B | 3.22B | 3.17B | 3.03B | 2.86B | 3.00B | 2.82B | 2.62B | 2.49B | 1.80B | 1.23B | 2.37B |
| Gross Profit | 6.98B | 7.25B | 6.47B | 5.29B | 5.09B | 5.65B | 5.60B | 5.60B | 5.37B | 5.30B | 4.99B | 5.35B | 5.05B | 4.61B | 4.22B | 4.21B | 3.77B | 3.83B | 3.58B | 3.45B | 2.30B | 2.46B |
| Gross Profit Ratio | 60.14% | 59.70% | 60.49% | 59.98% | 60.21% | 61.52% | 62.35% | 62.18% | 61.86% | 61.88% | 62.77% | 62.40% | 61.42% | 60.32% | 59.57% | 58.42% | 57.16% | 59.40% | 58.98% | 65.70% | 65.20% | 50.90% |
| Research & Development | 0.00 | 0.00 | 0.00 | 0.00 | 0.00 | 0.00 | 0.00 | 0.00 | 0.00 | 0.00 | 0.00 | 0.00 | 0.00 | 0.00 | 0.00 | 0.00 | 0.00 | 0.00 | 0.00 | 0.00 | 0.00 | 0.00 |
| General & Administrative | 0.00 | 0.00 | 0.00 | 0.00 | 0.00 | 0.00 | 0.00 | 0.00 | 0.00 | 0.00 | 0.00 | 0.00 | 1.36B | 0.00 | 1.16B | 1.13B | 1.07B | 1.04B | 1.08B | 685.00M | 0.00 | 0.00 |
| Selling & Marketing | 1.87B | 1.94B | 1.70B | 1.39B | 1.33B | 1.51B | 1.72B | 1.69B | 1.65B | 1.63B | 1.50B | 1.64B | 1.57B | 1.44B | 1.26B | 1.24B | 1.18B | 1.10B | 0.00 | 1.02B | 676.10M | 748.40M |
| SG&A | 1.87B | 1.94B | 1.70B | 1.39B | 1.33B | 1.51B | 1.72B | 1.69B | 1.65B | 1.63B | 1.50B | 1.64B | 2.93B | 1.44B | 2.42B | 2.36B | 2.24B | 1.04B | 1.08B | 1.02B | 676.10M | 748.40M |
| Other Expenses | 2.38B | 0.00 | -5.00M | -26.00M | -63.00M | -33.00M | 22.00M | 0.00 | 0.00 | 0.00 | 0.00 | 0.00 | 0.00 | -2.00M | 0.00 | -89.00M | -81.00M | 20.00M | -126.00M | 16.00M | 0.00 | 0.00 |
| Operating Expenses | 4.25B | 3.93B | 3.45B | 2.87B | 2.83B | 3.07B | 3.22B | 3.19B | 3.10B | 3.09B | 2.99B | 3.20B | 3.08B | 2.76B | 2.51B | 2.45B | 2.33B | 2.36B | 2.45B | 2.42B | 1.56B | 1.71B |
| Cost & Expenses | 8.87B | 8.82B | 7.68B | 6.40B | 6.19B | 6.60B | 6.61B | 6.60B | 6.41B | 6.35B | 5.95B | 6.42B | 6.25B | 5.79B | 5.37B | 5.45B | 5.15B | 4.98B | 4.94B | 4.22B | 2.79B | 4.09B |
| Interest Income | 39.00M | 7.00M | 48.00M | 36.00M | 36.00M | 32.00M | 73.00M | 46.00M | 63.00M | 65.00M | 76.00M | 17.00M | 22.00M | 72.00M | 17.00M | 581.00M | 316.00M | 332.00M | 319.00M | 0.00 | 0.00 | 0.00 |
| Interest Expense | 458.00M | 279.00M | 248.00M | 274.00M | 354.00M | 329.00M | 357.00M | 403.00M | 463.00M | 493.00M | 499.00M | 535.00M | 570.00M | 531.00M | 524.00M | 710.00M | 33.00M | 683.00M | 0.00 | 0.00 | 0.00 | 0.00 |
| Depreciation & Amortization | 441.00M | 417.00M | 381.00M | 367.00M | 350.00M | 226.00M | 289.00M | 292.00M | 329.00M | 214.00M | 203.00M | 185.00M | 172.00M | 159.00M | 160.00M | 157.00M | 166.00M | 149.00M | 148.00M | 169.20M | 108.10M | 112.90M |
| EBITDA | 3.19B | 3.75B | 3.33B | 2.63B | 1.32B | 2.80B | 2.56B | 2.60B | 2.48B | 2.43B | 2.24B | 2.34B | 2.16B | 2.08B | 1.88B | 1.91B | 1.61B | 1.62B | 1.28B | 1.20B | 847.30M | 863.20M |
| EBITDA Ratio | 27.49% | 30.39% | 31.68% | 30.22% | 30.02% | 30.41% | 29.51% | 29.49% | 29.03% | 28.35% | 27.90% | 27.25% | 26.33% | 27.25% | 26.62% | 26.57% | 24.39% | 25.08% | 21.05% | 22.86% | 23.98% | 17.85% |
| Operating Income | 2.72B | 3.27B | 2.96B | 2.36B | 978.00M | 2.38B | 2.30B | 2.23B | 2.10B | 1.59B | 1.82B | 2.11B | 1.97B | 1.85B | 1.71B | 1.76B | 1.44B | 1.47B | 1.13B | 1.03B | 739.20M | 750.30M |
| Operating Income Ratio | 23.49% | 26.90% | 27.69% | 26.76% | 11.58% | 25.87% | 25.55% | 24.78% | 24.13% | 18.58% | 22.87% | 24.56% | 23.97% | 24.23% | 24.11% | 24.39% | 21.87% | 22.77% | 18.61% | 19.63% | 20.92% | 15.52% |
| Total Other Income/Expenses | -444.00M | -327.00M | -260.00M | -376.00M | -366.00M | -310.00M | -300.00M | -375.00M | -433.00M | -491.00M | -484.00M | -554.00M | -548.00M | -459.00M | -507.00M | -691.00M | -348.00M | -351.00M | -351.00M | -89.00M | -101.60M | -153.30M |
| Income Before Tax | 2.28B | 2.94B | 2.70B | 1.99B | 608.00M | 2.07B | 2.00B | 1.86B | 1.66B | 1.10B | 1.33B | 1.57B | 1.42B | 1.39B | 1.20B | 1.07B | 1.09B | 1.12B | 778.00M | 898.90M | 637.60M | 597.00M |
| Income Before Tax Ratio | 19.66% | 24.21% | 25.26% | 22.56% | 7.20% | 22.49% | 22.21% | 20.61% | 19.14% | 12.84% | 16.78% | 18.29% | 17.30% | 18.23% | 16.96% | 14.91% | 16.59% | 17.32% | 12.83% | 17.13% | 18.04% | 12.35% |
| Income Tax Expense | 766.00M | 651.00M | 676.00M | 667.00M | 258.00M | 582.00M | 392.00M | 438.00M | 408.00M | 221.00M | 305.00M | 359.00M | 247.00M | 318.00M | 223.00M | 108.00M | 224.00M | 260.00M | 108.00M | 236.40M | 167.50M | 156.90M |
| Net Income | 1.48B | 2.26B | 2.00B | 1.31B | 329.00M | 1.46B | 1.58B | 1.39B | 1.24B | 861.00M | 1.02B | 1.17B | 1.15B | 1.05B | 951.00M | 945.00M | 840.00M | 831.00M | 639.00M | 657.30M | 463.80M | 412.80M |
| Net Income Ratio | 12.73% | 18.64% | 18.65% | 14.79% | 3.89% | 15.85% | 17.55% | 15.46% | 14.22% | 10.06% | 12.79% | 13.67% | 13.95% | 13.67% | 13.43% | 13.12% | 12.75% | 12.90% | 10.53% | 12.53% | 13.13% | 8.54% |
| EPS | 5.83 | 8.83 | 7.71 | 5.00 | 1.25 | 5.51 | 5.97 | 5.27 | 4.68 | 3.26 | 3.86 | 4.45 | 4.36 | 3.98 | 3.62 | 3.94 | 3.70 | 3.71 | 2.96 | 4.36 | 3.10 | 2.76 |
| EPS Diluted | 5.83 | 8.81 | 7.69 | 4.99 | 1.25 | 5.48 | 5.94 | 5.25 | 4.65 | 3.24 | 3.82 | 4.40 | 4.32 | 3.94 | 3.59 | 3.92 | 3.65 | 3.65 | 2.87 | 4.36 | 2.95 | 2.63 |
| Weighted Avg Shares Out | 253.17M | 256.05M | 259.03M | 260.80M | 262.86M | 264.17M | 264.11M | 264.23M | 263.99M | 263.98M | 263.31M | 263.39M | 262.94M | 262.69M | 262.68M | 239.57M | 226.95M | 224.05M | 216.03M | 150.73M | 70.48M | 149.38M |
| Weighted Avg Shares Out (Dil) | 253.19M | 256.88M | 259.72M | 261.51M | 264.04M | 265.42M | 265.54M | 265.48M | 265.63M | 266.23M | 265.82M | 266.35M | 265.15M | 264.86M | 265.03M | 241.22M | 230.32M | 227.94M | 223.06M | 150.73M | 70.48M | 157.15M |

Pernod Ricard: Attractive At 23x P/E Before Likely Strong H1 FY23 Results

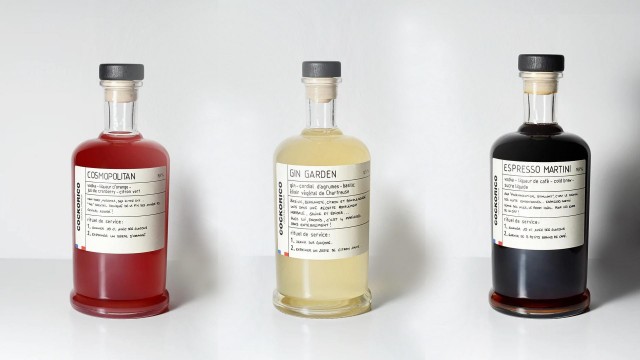
Pernod Ricard Invests In Ready-To-Drink Beverages Via A French Cocktail Brand Cockorico, New American Facility

Pernod Ricard: Quality Spirits Company Trading At An Undemanding Valuation

Pernod Ricard SA (PDRDF) Q1 2023 EMEA/LATAM Earnings Call Transcript

Pernod Ricard to Buy Stake in Tequila Maker Backed by Country Star George Strait

Diageo and Scotch whisky industry to thrive on potential UK and India free-trade agreement - broker

CEO Ann Mukherjee of Pernod Ricard North America on back-to-office idea: Workers must return 'with purpose'

Pernod Ricard SA (PDRDF) Q4 2022 Earnings Call Transcript

Pernod Ricard to buy back up to $754 million in shares after profit, sales jump

Pernod Ricard sees good start to Q1 after results beat forecast
Source: https://incomestatements.info
Category: Stock Reports
