See more : Sinolink Worldwide Holdings Limited (1168.HK) Income Statement Analysis – Financial Results
Complete financial analysis of Planet 13 Holdings Inc. (PLNHF) income statement, including revenue, profit margins, EPS and key performance metrics. Get detailed insights into the financial performance of Planet 13 Holdings Inc., a leading company in the Drug Manufacturers – Specialty & Generic industry within the Healthcare sector.
- 4imprint Group plc (FRRFF) Income Statement Analysis – Financial Results
- TNR Gold Corp. (TRRXF) Income Statement Analysis – Financial Results
- Balco Group AB (BALCO.ST) Income Statement Analysis – Financial Results
- Urals Stampings Plant PAO (URKZ.ME) Income Statement Analysis – Financial Results
- Mercury Ecommerce Acquisition Corp. (MEAC) Income Statement Analysis – Financial Results
Planet 13 Holdings Inc. (PLNHF)
Industry: Drug Manufacturers - Specialty & Generic
Sector: Healthcare
Website: https://www.planet13holdings.com
About Planet 13 Holdings Inc.
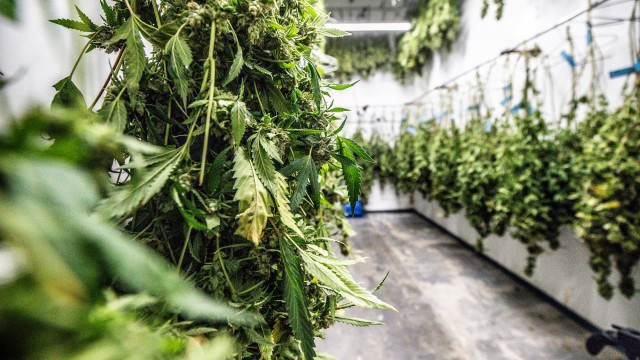
Planet 13 Holdings Inc., an integrated cannabis company, engages in the cultivation, production, distribution, and marketing of cannabis and cannabis-infused products for medical and retail cannabis markets in Nevada, the United States. The company also operates licensed cannabis dispensaries; non-cannabis retail merchandise store and event space; and owns and operates Trece Eatery + Spirits, coffee shop and pizzeria. In addition, it provides consultation, education, and convenience services. The company owns and manufactures chocolates, gummies, sparkling beverages, vapes and concentrates, and flowers under the TRENDI, Leaf & Vine, Dreamland, and HaHa, and Medizin brands. Planet 13 Holdings Inc. is headquartered in Las Vegas, Nevada.
| Metric | 2023 | 2022 | 2021 | 2020 | 2019 | 2018 | 2017 | 2016 |
|---|---|---|---|---|---|---|---|---|
| Revenue | 98.51M | 104.57M | 119.49M | 70.49M | 63.60M | 21.17M | 0.00 | 0.00 |
| Cost of Revenue | 53.68M | 56.60M | 53.49M | 35.12M | 27.62M | 10.31M | 0.00 | 0.00 |
| Gross Profit | 44.82M | 47.97M | 66.01M | 35.37M | 35.98M | 10.85M | 0.00 | 0.00 |
| Gross Profit Ratio | 45.50% | 45.88% | 55.24% | 50.18% | 56.57% | 51.27% | 0.00% | 0.00% |
| Research & Development | 0.00 | 0.00 | 0.00 | 0.00 | 0.00 | 0.00 | 0.00 | 0.00 |
| General & Administrative | 42.42M | 52.14M | 58.58M | 25.21M | 23.56M | 11.42M | 14.80K | 10.47K |
| Selling & Marketing | 5.37M | 3.50M | 5.97M | 3.31M | 6.54M | 1.70M | 0.00 | 0.00 |
| SG&A | 47.79M | 55.64M | 64.55M | 28.51M | 30.10M | 13.12M | 14.80K | 10.47K |
| Other Expenses | 0.00 | 8.34M | 9.29M | 6.13M | 4.38M | -16.06K | 0.00 | 0.00 |
| Operating Expenses | 47.79M | 63.98M | 73.84M | 34.64M | 34.48M | 14.29M | 14.80K | 10.47K |
| Cost & Expenses | 101.47M | 120.58M | 127.33M | 69.76M | 62.10M | 24.60M | 14.80K | 10.47K |
| Interest Income | 0.00 | 0.00 | 0.00 | 0.00 | 0.00 | 0.00 | 0.00 | 0.00 |
| Interest Expense | 195.72K | 454.89K | 16.98K | 1.80M | 1.31M | 241.86K | 0.00 | 0.00 |
| Depreciation & Amortization | 167.90K | 11.63M | 5.54M | 6.06M | 3.96M | 988.77K | 52.52K | 22.82K |
| EBITDA | -52.92M | -40.42M | -422.51K | 6.79M | 5.46M | -2.46M | -14.80K | -10.47K |
| EBITDA Ratio | -53.72% | 19.81% | -1.92% | 9.63% | 8.58% | -11.63% | 0.00% | 0.00% |
| Operating Income | -61.10M | 9.08M | -7.83M | 730.52K | 1.50M | -3.44M | -14.80K | -10.47K |
| Operating Income Ratio | -62.03% | 8.68% | -6.56% | 1.04% | 2.35% | -16.23% | 0.00% | 0.00% |
| Total Other Income/Expenses | 72.63M | -49.31M | 1.85M | -1.58M | -954.96K | -5.00M | 0.00 | 0.00 |
| Income Before Tax | 11.53M | -40.23M | -5.98M | -849.27K | 542.66K | -8.43M | -14.80K | -10.47K |
| Income Before Tax Ratio | 11.71% | -38.47% | -5.01% | -1.20% | 0.85% | -39.84% | 0.00% | 0.00% |
| Income Tax Expense | 11.53M | 8.75M | 13.48M | 7.09M | 7.20M | 2.29M | 0.00 | 0.00 |
| Net Income | 0.00 | -48.98M | -19.46M | -7.94M | -6.66M | -10.72M | -14.80K | -10.47K |
| Net Income Ratio | 0.00% | -46.84% | -16.29% | -11.27% | -10.47% | -50.66% | 0.00% | 0.00% |
| EPS | 0.00 | -0.23 | -0.10 | -0.05 | -0.05 | -0.11 | 0.00 | 0.00 |
| EPS Diluted | 0.00 | -0.23 | -0.10 | -0.05 | -0.05 | -0.11 | 0.00 | 0.00 |
| Weighted Avg Shares Out | 221.96M | 216.59M | 195.13M | 151.83M | 134.07M | 96.00M | 117.24M | 117.24M |
| Weighted Avg Shares Out (Dil) | 221.96M | 216.59M | 195.13M | 151.83M | 134.07M | 96.00M | 117.24M | 117.24M |

Cannabis MSO shares rise with marijuana banking reform poised to win Senate Committee's approval

Planet 13 Announces Intended Completion of Change in Domicile to Nevada and Intended OTC Market and Trading Symbol Change

Top Marijuana Stocks to Watch in Mid September 2023

Ovation Science Signs License Agreement with Planet 13 for Its Topical / Transdermal Cannabis Products for Nevada

Marijuana rescheduling would be ‘life-changing event' for cannabis companies, CEOs say

3 Marijuana Stocks For Cannabis Investing September 2023

Cannabis stock rally continues on marijuana rescheduling hopes

Cannabis stocks set to end week on a high following marijuana rescheduling recommendation

Top Marijuana Penny Stocks for September 2023

Planet 13 Holdings accelerates Florida expansion with $49M VidaCann acquisition
Source: https://incomestatements.info
Category: Stock Reports
