See more : AstraZeneca Pharma India Limited (ASTRAZEN.BO) Income Statement Analysis – Financial Results
Complete financial analysis of Patriot Battery Metals Inc. (PMETF) income statement, including revenue, profit margins, EPS and key performance metrics. Get detailed insights into the financial performance of Patriot Battery Metals Inc., a leading company in the Industrial Materials industry within the Basic Materials sector.
- Sheh Fung Screws Co.,Ltd (2065.TWO) Income Statement Analysis – Financial Results
- Mopals.com, Inc. (PALS) Income Statement Analysis – Financial Results
- Healthcare Integrated Technologies, Inc. (HITC) Income Statement Analysis – Financial Results
- Imagine Lithium Inc. (ARXRF) Income Statement Analysis – Financial Results
- Mynaric AG (M0YN.DE) Income Statement Analysis – Financial Results
Patriot Battery Metals Inc. (PMETF)
About Patriot Battery Metals Inc.
Patriot Battery Metals Inc. engages in the identification, evaluation, acquisition, and exploration of mineral properties. The company primarily explores for gold, copper, silver, platinum, and lithium deposits. Its flagship properties include Corvette- FCI project comprising 417 claims totaling 21,357 hectares located in Quebec. The company was formerly known as Gaia Metals Corp. and changed its name to Patriot Battery Metals Inc. in June 2021. Patriot Battery Metals Inc. was incorporated in 2007 and is headquartered in Vancouver, Canada.
| Metric | 2024 | 2023 | 2022 | 2021 | 2020 | 2019 | 2018 | 2017 | 2016 | 2015 | 2014 | 2013 | 2012 | 2011 | 2010 | 2009 |
|---|---|---|---|---|---|---|---|---|---|---|---|---|---|---|---|---|
| Revenue | 0.00 | 0.00 | 0.00 | 0.00 | 0.00 | 0.00 | 0.00 | 0.00 | 0.00 | 0.00 | 0.00 | 0.00 | 0.00 | 0.00 | 0.00 | 0.00 |
| Cost of Revenue | 876.00K | 21.00K | 0.00 | 0.00 | 0.00 | 0.00 | 0.00 | 0.00 | 0.00 | 2.57 | 0.00 | 3.70 | 0.00 | 0.00 | 0.00 | 0.00 |
| Gross Profit | -876.00K | -21.00K | 0.00 | 0.00 | 0.00 | 0.00 | 0.00 | 0.00 | 0.00 | -2.57 | 0.00 | -3.70 | 0.00 | 0.00 | 0.00 | 0.00 |
| Gross Profit Ratio | 0.00% | 0.00% | 0.00% | 0.00% | 0.00% | 0.00% | 0.00% | 0.00% | 0.00% | 0.00% | 0.00% | 0.00% | 0.00% | 0.00% | 0.00% | 0.00% |
| Research & Development | 0.00 | 0.00 | 0.00 | 0.00 | 0.00 | 0.00 | 0.00 | 0.00 | 0.00 | 0.00 | 0.00 | 0.00 | 0.00 | 0.00 | 0.00 | 0.00 |
| General & Administrative | 11.48M | 16.28M | 3.92M | 685.07K | 684.69K | 756.73K | 853.78K | 571.93K | 371.78K | 397.29K | 343.45K | 671.44K | 637.95K | 536.93K | 142.96K | 53.23K |
| Selling & Marketing | 8.31M | 540.00K | 225.00K | 69.82K | 35.14K | 104.62K | 110.49K | 305.66K | 87.23K | 27.89K | 36.50K | 72.30K | 33.31K | 25.19K | 0.00 | 0.00 |
| SG&A | 19.78M | 17.17M | 4.15M | 774.20K | 751.83K | 886.55K | 987.11K | 881.97K | 459.58K | 425.18K | 379.94K | 743.74K | 671.26K | 562.12K | 142.96K | 53.23K |
| Other Expenses | 0.00 | 10.30M | 600.00K | 0.00 | 249.83K | 23.54K | 22.14K | -6.50K | 0.00 | 0.00 | 0.00 | 0.00 | 0.00 | 0.00 | 0.00 | 0.00 |
| Operating Expenses | 19.78M | 17.17M | 4.15M | 774.20K | 751.83K | 886.55K | 987.11K | 881.97K | 459.58K | 427.95K | 353.61K | 748.19K | 713.71K | 562.12K | 142.96K | 53.23K |
| Cost & Expenses | 19.78M | 17.20M | 4.15M | 774.20K | 751.83K | 886.55K | 987.11K | 881.97K | 459.58K | 427.95K | 353.61K | 748.19K | 713.71K | 562.12K | 142.96K | 53.23K |
| Interest Income | 4.73M | 22.00K | 2.00K | 29.00 | 140.00 | 4.09K | 1.71K | 50.00 | 0.00 | 0.00 | 0.00 | 0.00 | 0.00 | 0.00 | 0.00 | 592.00 |
| Interest Expense | 0.00 | 89.00K | 2.30K | 873.00 | 8.50K | 1.47K | 831.00 | 824.00 | 1.73K | 2.46K | 1.79K | 7.55K | 31.17K | 0.00 | 0.00 | 0.00 |
| Depreciation & Amortization | 876.00K | 21.00K | 330.00K | 18.59K | 18.59K | 832.31K | 75.00K | 75.00K | 437.15K | 139.50 | 28.37K | 529.04 | 31.17K | 0.00 | 0.00 | 0.00 |
| EBITDA | -18.91M | -16.15M | -3.55M | -695.71K | -751.83K | 0.00 | -845.87K | -850.17K | 0.00 | -427.95K | -353.61K | -748.19K | -713.71K | -562.12K | -142.96K | -53.23K |
| EBITDA Ratio | 0.00% | 0.00% | 0.00% | 0.00% | 0.00% | 0.00% | 0.00% | 0.00% | 0.00% | 0.00% | 0.00% | 0.00% | 0.00% | 0.00% | 0.00% | 0.00% |
| Operating Income | -19.78M | -17.20M | -4.15M | -774.20K | -751.83K | -886.55K | -987.11K | -881.97K | -459.58K | -427.95K | -381.98K | -748.19K | -744.87K | -562.12K | -142.96K | -53.23K |
| Operating Income Ratio | 0.00% | 0.00% | 0.00% | 0.00% | 0.00% | 0.00% | 0.00% | 0.00% | 0.00% | 0.00% | 0.00% | 0.00% | 0.00% | 0.00% | 0.00% | 0.00% |
| Total Other Income/Expenses | 32.40M | 9.21M | -1.08M | -60.74K | 160.71K | -180.06K | -43.82K | -114.08K | -24.16K | 30.14K | -63.76K | -178.55K | -765.13K | 0.00 | 0.00 | 592.00 |
| Income Before Tax | 12.61M | -6.96M | -3.88M | -775.05K | -528.96K | -1.01M | -964.69K | -964.25K | -461.31K | -397.81K | -421.33K | -926.75K | -1.51M | -562.12K | -142.96K | -52.64K |
| Income Before Tax Ratio | 0.00% | 0.00% | 0.00% | 0.00% | 0.00% | 0.00% | 0.00% | 0.00% | 0.00% | 0.00% | 0.00% | 0.00% | 0.00% | 0.00% | 0.00% | 0.00% |
| Income Tax Expense | 10.01M | 3.15M | -330.00 | -18.59 | -18.59 | -832.31 | -51.75K | -81.45K | -437.15K | 2.32K | -26.58K | 7.02K | 0.00 | 0.00 | -4.42K | -25.23K |
| Net Income | 2.61M | -10.12M | -3.88M | -775.05K | -528.96K | -1.01M | -964.69K | -964.25K | -461.31K | -397.81K | -421.33K | -926.75K | -1.51M | -562.12K | -138.55K | -27.41K |
| Net Income Ratio | 0.00% | 0.00% | 0.00% | 0.00% | 0.00% | 0.00% | 0.00% | 0.00% | 0.00% | 0.00% | 0.00% | 0.00% | 0.00% | 0.00% | 0.00% | 0.00% |
| EPS | 0.02 | -0.11 | -0.10 | -0.09 | -0.15 | -0.40 | -0.49 | -0.69 | -0.74 | -1.26 | -4.77 | -30.71 | -68.88 | -32.06 | -19.15 | -5.85 |
| EPS Diluted | 0.02 | -0.11 | -0.10 | -0.09 | -0.15 | -0.40 | -0.49 | -0.69 | -0.74 | -1.26 | -4.77 | -30.71 | -68.88 | -32.06 | -19.15 | -5.85 |
| Weighted Avg Shares Out | 130.31M | 89.73M | 37.66M | 8.26M | 3.59M | 2.56M | 1.97M | 1.41M | 626.49K | 314.57K | 88.36K | 30.17K | 21.92K | 17.53K | 7.24K | 4.69K |
| Weighted Avg Shares Out (Dil) | 121.54M | 89.73M | 37.66M | 8.26M | 3.59M | 2.56M | 1.97M | 1.41M | 626.49K | 314.57K | 88.36K | 30.17K | 21.92K | 17.53K | 7.24K | 4.69K |
Patriot Battery Metals' Corvette property is 'resource growth in the fast lane,' analysts say

A Look At 4 Promising Lithium Juniors With Projects In Brazil
Patriot Battery Metals a 'Speculative Buy' for Stifel analysts following promising maiden drill results at Corvette property in Quebec
Victory Battery Metals acquires new property in James Bay Lithium District adjacent to Patriot Battery Metals Corvette property
Infinity Stone further expands Camaro Hellcat lithium project near Patriot Battery Metals' Corvette discovery
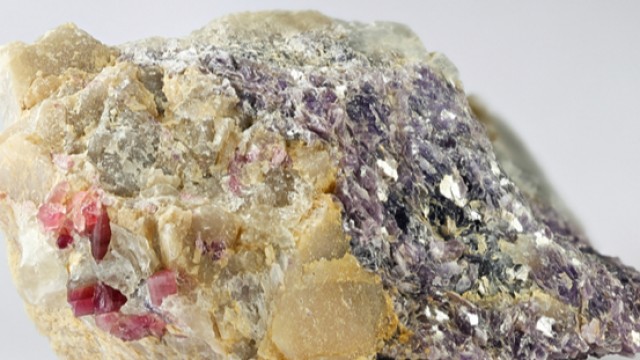
Patriot Battery Metals shares soar 20%; Canaccord analysts highlight high-grade lithium drill intercept

Patriot Battery Metals Has Great Potential At Corvette Lithium Project
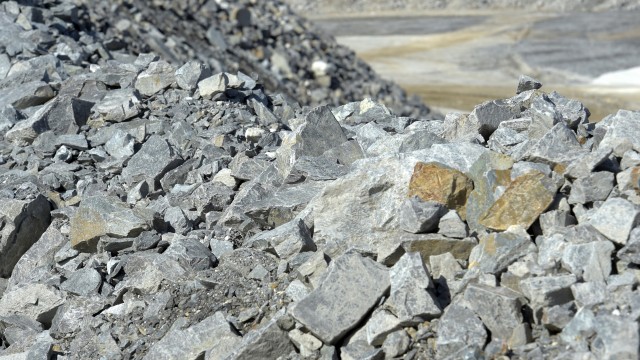
Patriot Battery Metals stands out amongst its peers as Canadian lithium investment opportunity, analysts say
Patriot Battery Metals Could Be The Next Billion Dollar Lithium Company
Patriot Battery Metals jumps on appointment
Source: https://incomestatements.info
Category: Stock Reports
