See more : Z-Work Acquisition Corp. (ZWRKW) Income Statement Analysis – Financial Results
Complete financial analysis of Permian Resources Corporation (PR) income statement, including revenue, profit margins, EPS and key performance metrics. Get detailed insights into the financial performance of Permian Resources Corporation, a leading company in the Oil & Gas Exploration & Production industry within the Energy sector.
- Entra ASA (ENTRA.OL) Income Statement Analysis – Financial Results
- Track & Field Co S.A. (TFCO4.SA) Income Statement Analysis – Financial Results
- SJ Corporation Limited (SJCORP.BO) Income Statement Analysis – Financial Results
- Exscientia plc (EXAI) Income Statement Analysis – Financial Results
- PT Lion Metal Works Tbk (LION.JK) Income Statement Analysis – Financial Results
Permian Resources Corporation (PR)
About Permian Resources Corporation
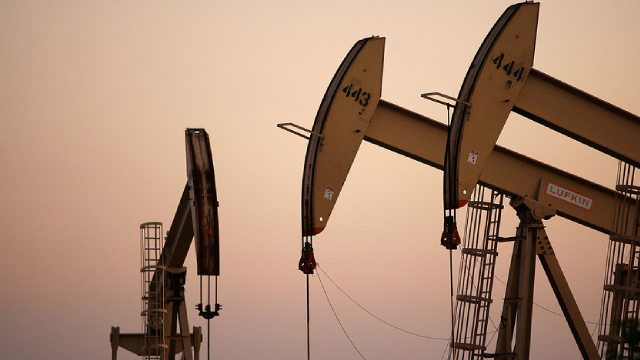
Permian Resources Corporation, an independent oil and natural gas company, focuses on the development of crude oil and related liquids-rich natural gas reserves in the United States. Its assets primarily focus on the Delaware Basin, a sub-basin of the Permian Basin. The company's properties consist of acreage blocks primarily in Reeves County, West Texas and Lea County, New Mexico. As of December 31, 2021, it leased or acquired approximately 73,675 net acres; and owned 991 net mineral acres in the Delaware Basin. The company was formerly known as Centennial Resource Development, Inc. and changed its name to Permian Resources Corporation in September 2022. Permian Resources Corporation was incorporated in 2015 and is headquartered in Midland, Texas.
| Metric | 2023 | 2022 | 2021 | 2020 | 2019 | 2018 | 2017 | 2016 | 2015 | 2014 | 2013 | 2012 |
|---|---|---|---|---|---|---|---|---|---|---|---|---|
| Revenue | 3.12B | 2.13B | 1.03B | 580.46M | 944.33M | 891.05M | 429.90M | 98.83M | 90.46M | 131.83M | 70.77M | 60.26M |
| Cost of Revenue | 1.47B | 714.46M | 481.44M | 539.15M | 663.05M | 467.40M | 237.22M | 99.19M | 116.99M | 91.57M | 23.35M | 26.86M |
| Gross Profit | 1.65B | 1.42B | 548.46M | 41.31M | 281.28M | 423.65M | 192.68M | -355.00K | -26.53M | 40.25M | 47.42M | 33.40M |
| Gross Profit Ratio | 52.88% | 66.48% | 53.25% | 7.12% | 29.79% | 47.54% | 44.82% | -0.36% | -29.33% | 30.54% | 67.01% | 55.43% |
| Research & Development | 0.00 | 0.00 | 0.00 | 0.00 | 0.00 | 0.00 | 0.00 | 0.00 | 0.00 | 0.00 | 0.00 | 0.00 |
| General & Administrative | 161.86M | 159.55M | 110.45M | 72.87M | 79.16M | 63.30M | 49.88M | 204.69M | 14.21M | 31.69M | 16.84M | 6.94M |
| Selling & Marketing | 0.00 | 0.00 | 0.00 | 0.00 | 0.00 | 0.00 | 0.00 | 0.00 | 0.00 | 0.00 | 1.16M | 1.78M |
| SG&A | 161.86M | 159.55M | 110.45M | 72.87M | 79.16M | 63.30M | 49.88M | 204.69M | 14.21M | 31.69M | 18.00M | 8.72M |
| Other Expenses | 391.90M | 167.10M | 75.02M | 57.77M | 74.59M | 8.00K | 37.55M | 6.18M | 20.00K | 281.00K | 0.00 | 0.00 |
| Operating Expenses | 553.76M | 326.66M | 185.48M | 130.64M | 153.75M | 129.80M | 87.43M | 210.87M | 21.70M | 38.57M | 42.22M | 526.00K |
| Cost & Expenses | 2.02B | 1.04B | 666.91M | 669.78M | 816.80M | 597.19M | 324.65M | 310.05M | 138.69M | 130.14M | 65.57M | 27.38M |
| Interest Income | 0.00 | 95.65M | 61.29M | 69.19M | 55.99M | 0.00 | 0.00 | 0.00 | 0.00 | 0.00 | 513.00K | 1.08M |
| Interest Expense | 177.21M | 95.65M | 61.29M | 69.19M | 55.99M | 26.36M | 5.73M | 6.00M | 6.27M | 2.48M | 0.00 | 0.00 |
| Depreciation & Amortization | 1.01B | 444.68M | 289.12M | 365.17M | 444.24M | 326.99M | 161.63M | 77.84M | 90.08M | 68.95M | 36.69M | 29.64M |
| EBITDA | 2.22B | 1.41B | 489.15M | -335.96M | 522.45M | 625.52M | 272.02M | -144.27M | 57.45M | 90.74M | 25.01M | 27.55M |
| EBITDA Ratio | 71.15% | 72.04% | 63.36% | 46.40% | 13.54% | 32.98% | 62.08% | -135.13% | 46.29% | 53.80% | 35.34% | 45.72% |
| Operating Income | 1.10B | 1.01B | 370.62M | -89.25M | -316.38M | 282.72M | 105.28M | -213.73M | -55.85M | -20.44M | -11.67M | -2.08M |
| Operating Income Ratio | 35.13% | 47.27% | 35.99% | -15.38% | -33.50% | 31.73% | 24.49% | -216.25% | -61.74% | -15.50% | -16.50% | -3.46% |
| Total Other Income/Expenses | -60.86M | -137.40M | -231.87M | 9.80M | -57.22M | -11.01M | -591.00K | -14.35M | 16.95M | 39.75M | -4.80M | 34.93M |
| Income Before Tax | 1.04B | 870.13M | 138.74M | -770.32M | 22.21M | 272.18M | 113.49M | -228.12M | -38.90M | 19.31M | 4.69M | 32.85M |
| Income Before Tax Ratio | 33.18% | 40.83% | 13.47% | -132.71% | 2.35% | 30.55% | 26.40% | -230.81% | -43.00% | 14.65% | 6.63% | 54.51% |
| Income Tax Expense | 155.95M | 120.29M | 569.00K | -85.12M | 5.80M | 59.44M | 29.93M | -406.00K | -572.00K | 1.52M | 1.08M | 563.00K |
| Net Income | 476.31M | 749.84M | 138.18M | -685.20M | 15.80M | 199.90M | 75.57M | -226.81M | -38.33M | 17.79M | 3.62M | 32.28M |
| Net Income Ratio | 15.26% | 35.18% | 13.42% | -118.04% | 1.67% | 22.43% | 17.58% | -229.48% | -42.37% | 13.50% | 5.11% | 53.57% |
| EPS | 1.38 | 2.62 | 0.49 | -2.47 | 0.06 | 0.76 | 0.32 | -1.13 | -2.96 | 0.61 | 0.13 | 1.11 |
| EPS Diluted | 1.24 | 2.32 | 0.46 | -2.47 | 0.06 | 0.75 | 0.32 | -1.13 | -2.96 | 0.61 | 0.13 | 1.11 |
| Weighted Avg Shares Out | 349.21M | 286.16M | 280.87M | 277.37M | 267.70M | 263.03M | 235.45M | 201.09M | 12.94M | 29.02M | 29.02M | 29.02M |
| Weighted Avg Shares Out (Dil) | 389.10M | 322.82M | 310.17M | 277.37M | 276.63M | 266.53M | 239.75M | 201.09M | 12.94M | 29.02M | 29.02M | 29.02M |

Oil, Gas, And Dividends: Why Permian Resources Remains Massively Undervalued

High Yield Oil And Gas Ranked By Relative Quality

My Portfolio's Biggest Winners And Losers From A Republican Sweep

Permian Resources Corporation (PR) Q3 2024 Earnings Call Transcript

Permian Resources (PR) Q3 Earnings Surpass Estimates

Permian Resources Announces Strong Third Quarter 2024 Results and Increased Full Year Guidance

Permian Resources: A Palatable Energy Play

8 Stocks I'm Buying No Matter How The U.S. Election Goes

Analysts Estimate Permian Resources (PR) to Report a Decline in Earnings: What to Look Out for

Canada Axes Immigration Target By 21%: Whats Next For Indians?
Source: https://incomestatements.info
Category: Stock Reports
