See more : FTAC Athena Acquisition Corp. (FTAAW) Income Statement Analysis – Financial Results
Complete financial analysis of Presto Automation, Inc. (PRST) income statement, including revenue, profit margins, EPS and key performance metrics. Get detailed insights into the financial performance of Presto Automation, Inc., a leading company in the Software – Application industry within the Technology sector.
- Cardio Diagnostics Holdings, Inc. (CDIO) Income Statement Analysis – Financial Results
- Kusuri No Aoki Holdings Co., Ltd. (3549.T) Income Statement Analysis – Financial Results
- PT Kusuma Kemindo Sentosa Tbk (KKES.JK) Income Statement Analysis – Financial Results
- TrueBlue, Inc. (TBI) Income Statement Analysis – Financial Results
- Route Mobile Limited (ROUTE.NS) Income Statement Analysis – Financial Results
Presto Automation, Inc. (PRST)
About Presto Automation, Inc.
Presto Automation, Inc. provides labor automation technology solutions in the hospitality industry. The company offers a platform of voice, vision, and touch solutions, which increase staff productivity and improve the guest experience. Presto Automation, Inc. was incorporated in 2008 and is headquartered in San Carlos, California.
| Metric | 2022 | 2021 | 2020 | 2019 |
|---|---|---|---|---|
| Revenue | 26.14M | 30.35M | 29.91M | 21.51M |
| Cost of Revenue | 25.61M | 29.72M | 28.86M | 16.43M |
| Gross Profit | 521.00K | 633.00K | 1.05M | 5.08M |
| Gross Profit Ratio | 1.99% | 2.09% | 3.50% | 23.63% |
| Research & Development | 21.31M | 16.78M | 14.99M | 18.75M |
| General & Administrative | 26.77M | 9.85M | 4.34M | 3.36M |
| Selling & Marketing | 8.85M | 6.64M | 2.90M | 2.43M |
| SG&A | 35.62M | 16.49M | 7.24M | 5.79M |
| Other Expenses | 0.00 | 582.00K | 3.34M | 0.00 |
| Operating Expenses | 56.93M | 33.85M | 25.57M | 24.54M |
| Cost & Expenses | 82.54M | 63.57M | 54.43M | 40.97M |
| Interest Income | 0.00 | 41.21K | 4.66M | 2.30M |
| Interest Expense | 12.76M | 5.43M | 5.27M | 2.34M |
| Depreciation & Amortization | 1.68M | 2.40M | 5.87M | 3.18M |
| EBITDA | -20.04M | -33.21M | -18.65M | -18.30M |
| EBITDA Ratio | -76.66% | -92.86% | -62.34% | -75.71% |
| Operating Income | -56.41M | -33.21M | -24.52M | -19.46M |
| Operating Income Ratio | -215.83% | -109.43% | -81.97% | -90.48% |
| Total Other Income/Expenses | 21.94M | -23.33M | -25.26M | -4.35M |
| Income Before Tax | -34.47M | -56.54M | -49.78M | -23.81M |
| Income Before Tax Ratio | -131.90% | -186.30% | -166.42% | -110.68% |
| Income Tax Expense | 9.00K | -230.00K | 23.00K | 1.00K |
| Net Income | -34.48M | -56.31M | -49.80M | -23.81M |
| Net Income Ratio | -131.93% | -185.54% | -166.50% | -110.69% |
| EPS | -0.74 | -2.61 | -2.58 | -0.47 |
| EPS Diluted | -0.74 | -2.61 | -2.58 | -0.47 |
| Weighted Avg Shares Out | 46.50M | 21.56M | 19.31M | 50.64M |
| Weighted Avg Shares Out (Dil) | 46.50M | 21.56M | 19.31M | 50.64M |

Presto to Report Second Quarter 2023 Financial Results on February 14, 2023
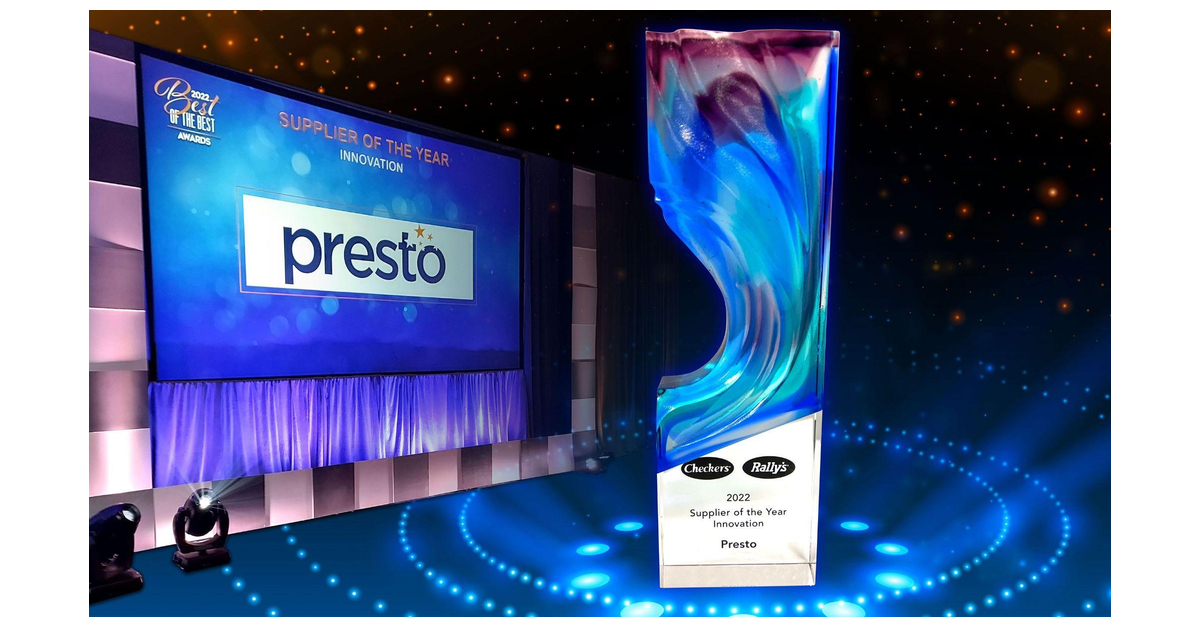
Presto Named Supplier of the Year for Innovation by Checkers & Rally’s

Presto Voice A.I. to Significantly Expand at Del Taco Drive-Thru Restaurants

Presto Automation, Inc. to Participate in the 25th Annual ICR Conference on January 10, 2023

Presto Voice Brings Custom Voices to Enhance Automated Drive-Thru Guest Experience

Presto Automation Inc. Announces First Quarter Fiscal 2023 Financial Results

Presto Automation Inc. Announces First Quarter Fiscal 2023 Financial Results

Presto to Report First Quarter 2023 Financial Results on November 15, 2022

Presto Completes $1B SPAC Merger to Go Public

Faruqi & Faruqi, LLP Is Seeking More Cash For The Shareholders Of Presstek, Inc. (PRST)
Source: https://incomestatements.info
Category: Stock Reports
