See more : Novozymes A/S (NVZMY) Income Statement Analysis – Financial Results
Complete financial analysis of Quince Therapeutics, Inc. (QNCX) income statement, including revenue, profit margins, EPS and key performance metrics. Get detailed insights into the financial performance of Quince Therapeutics, Inc., a leading company in the Biotechnology industry within the Healthcare sector.
- Gourmet Provisions International Corporation (GMPR) Income Statement Analysis – Financial Results
- Auplata Mining Group (ALAMG.PA) Income Statement Analysis – Financial Results
- Mobileye Global Inc. (MBLY) Income Statement Analysis – Financial Results
- NACCO Industries, Inc. (NC) Income Statement Analysis – Financial Results
- Regional REIT Limited (RGL.L) Income Statement Analysis – Financial Results
Quince Therapeutics, Inc. (QNCX)
About Quince Therapeutics, Inc.
Quince Therapeutics, Inc., a biopharmaceutical company, focuses on advancing precision therapeutics for debilitating and rare diseases. The company has discovered a broad bone-targeting drug platform to precisely deliver small molecules, peptides, or large molecules directly to the site of bone fracture and disease. Its lead compound is NOV004, an anabolic peptide engineered to precisely target and concentrate at the bone fracture site The company was formerly known as Cortexyme, Inc. and changed its name to Quince Therapeutics, Inc. in August 2022. Quince Therapeutics, Inc. was incorporated in 2012 and is headquartered in South San Francisco, California.
| Metric | 2023 | 2022 | 2021 | 2020 | 2019 | 2018 | 2017 |
|---|---|---|---|---|---|---|---|
| Revenue | 0.00 | 0.00 | 0.00 | 0.00 | 0.00 | 0.00 | 0.00 |
| Cost of Revenue | 322.00K | 175.00K | 344.00K | 332.00K | 188.00K | 51.00K | 45.00K |
| Gross Profit | -322.00K | -175.00K | -344.00K | -332.00K | -188.00K | -51.00K | -45.00K |
| Gross Profit Ratio | 0.00% | 0.00% | 0.00% | 0.00% | 0.00% | 0.00% | 0.00% |
| Research & Development | 9.45M | 25.18M | 60.80M | 61.31M | 30.21M | 10.09M | 9.10M |
| General & Administrative | 17.70M | 26.01M | 29.52M | 17.59M | 8.95M | 2.03M | 1.27M |
| Selling & Marketing | 0.00 | 0.00 | 0.00 | 0.00 | 0.00 | 0.00 | 0.00 |
| SG&A | 17.70M | 26.01M | 29.52M | 17.59M | 8.95M | 2.03M | 1.27M |
| Other Expenses | 7.48M | -997.00K | -247.00K | 0.00 | 0.00 | 0.00 | 0.00 |
| Operating Expenses | 34.62M | 51.19M | 90.32M | 78.89M | 39.17M | 12.12M | 10.37M |
| Cost & Expenses | 34.62M | 51.19M | 90.32M | 78.89M | 39.17M | 12.12M | 10.37M |
| Interest Income | 3.48M | 1.07M | 620.00K | 2.04M | 2.19M | 806.00K | 0.00 |
| Interest Expense | 0.00 | 568.00K | 0.00 | 0.00 | 0.00 | 957.00K | 1.64M |
| Depreciation & Amortization | 322.00K | 175.00K | 344.00K | 332.00K | 188.00K | 51.00K | 45.00K |
| EBITDA | -31.26M | -52.02M | -89.97M | -78.56M | -38.98M | -12.07M | -10.33M |
| EBITDA Ratio | 0.00% | 0.00% | 0.00% | 0.00% | 0.00% | 0.00% | 0.00% |
| Operating Income | -34.62M | -52.02M | -90.32M | -78.89M | -39.17M | -12.12M | -10.37M |
| Operating Income Ratio | 0.00% | 0.00% | 0.00% | 0.00% | 0.00% | 0.00% | 0.00% |
| Total Other Income/Expenses | 3.04M | 71.00K | 373.00K | 2.04M | 2.19M | -357.00K | -1.87M |
| Income Before Tax | -31.58M | -51.94M | -89.95M | -76.85M | -36.98M | -12.48M | -12.24M |
| Income Before Tax Ratio | 0.00% | 0.00% | 0.00% | 0.00% | 0.00% | 0.00% | 0.00% |
| Income Tax Expense | -197.00K | -284.00K | -620.00K | 2.17M | -188.00K | 357.00K | 1.87M |
| Net Income | -31.39M | -51.66M | -89.33M | -76.85M | -36.79M | -12.48M | -12.24M |
| Net Income Ratio | 0.00% | 0.00% | 0.00% | 0.00% | 0.00% | 0.00% | 0.00% |
| EPS | -0.84 | -1.54 | -3.01 | -2.63 | -1.93 | -0.58 | -0.57 |
| EPS Diluted | -0.84 | -1.54 | -3.01 | -2.63 | -1.93 | -0.58 | -0.57 |
| Weighted Avg Shares Out | 37.24M | 33.50M | 29.72M | 29.18M | 19.03M | 21.55M | 21.55M |
| Weighted Avg Shares Out (Dil) | 37.24M | 33.50M | 29.72M | 29.18M | 19.03M | 21.55M | 21.55M |

4,400 Shares in Cortexyme, Inc. (NASDAQ:CRTX) Acquired by TD Asset Management Inc.

Mallinckrodt BLA Submission, And Other News: The Good, Bad And Ugly Of Biopharma

Bristol Myers Squibb NDA, And Other News: The Good, Bad And Ugly Of Biopharma

Stocks To Watch: Big Focus On Big Tech

Cortexyme Announces Upcoming Data Presentations at the Alzheimer’s Association International Conference 2020

Legal & General Group Plc Trims Position in Cortexyme, Inc. (NASDAQ:CRTX)

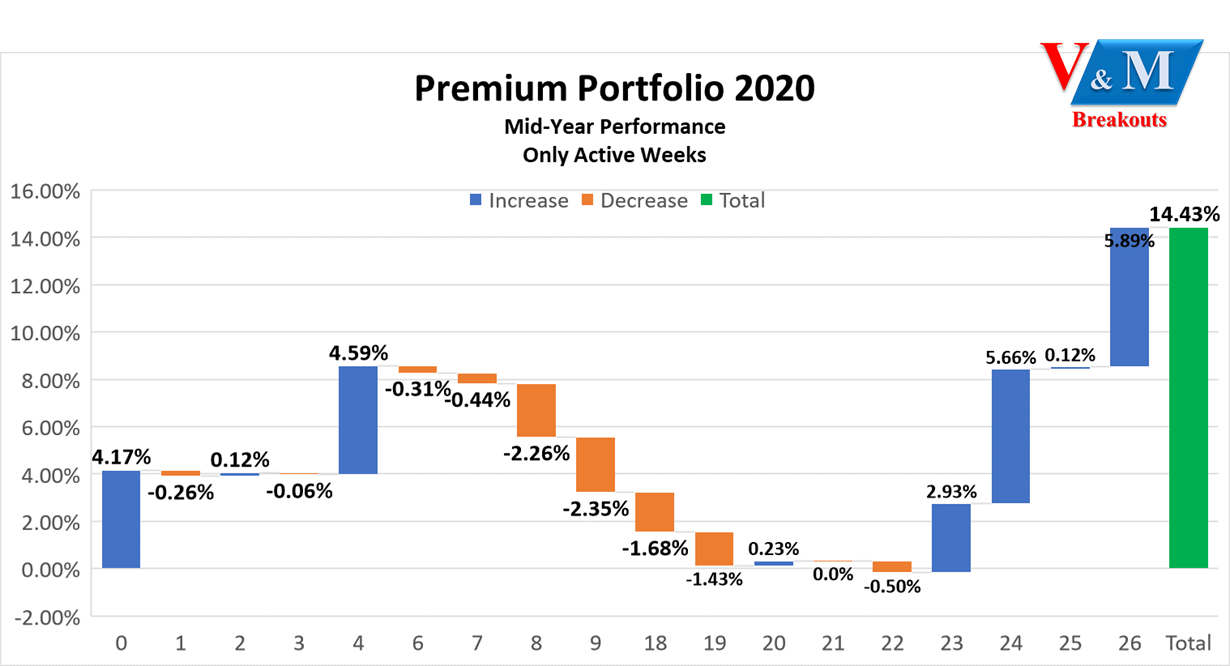
V&M Premium Portfolio: 2020 Mid-Year Report Card Through Week 26

HC Wainwright Initiates Coverage on Cortexyme (NASDAQ:CRTX)

Cortexyme (NASDAQ:CRTX) Stock Rating Lowered by Zacks Investment Research

Citigroup Inc. Has $158,000 Stock Holdings in Cortexyme, Inc. (NASDAQ:CRTX)
Source: https://incomestatements.info
Category: Stock Reports
