See more : Aviv Arlon Ltd. (AVLN.TA) Income Statement Analysis – Financial Results
Complete financial analysis of Reckitt Benckiser Group plc (RBGPF) income statement, including revenue, profit margins, EPS and key performance metrics. Get detailed insights into the financial performance of Reckitt Benckiser Group plc, a leading company in the Household & Personal Products industry within the Consumer Defensive sector.
- Shilpa Medicare Limited (SHILPAMED.BO) Income Statement Analysis – Financial Results
- MATERIAL GROUP INC (156A.T) Income Statement Analysis – Financial Results
- The Beachbody Company, Inc. (BODI) Income Statement Analysis – Financial Results
- The Straits Trading Company Limited (STTSY) Income Statement Analysis – Financial Results
- Guangzhou Shangpin Home Collection Co., Ltd. (300616.SZ) Income Statement Analysis – Financial Results
Reckitt Benckiser Group plc (RBGPF)
About Reckitt Benckiser Group plc
Reckitt Benckiser Group plc manufactures and sells health, hygiene, and nutrition products in the United Kingdom, the United States, China, India, and internationally. The company offers acne treatment creams, facial washes, and cleansing pads; disinfection, hygiene, and first aid products; condoms, sex toys, and lubricants; heartburn and indigestion solutions; and cough and chest congestion, multi-symptom, and sinus remedies for adults and children under the Clearasil, Dettol, Durex, Gaviscon, and Mucinex brands. It also provides analgesics; sore throat medications; and hair removal products under the Nurofen, Strepsils, and Veet brands. In addition, the company offers fragrances and devices; water softeners; home cleaning products; dish washes; toilet cleaners; disinfectants; sprays, baits, and plug-ins for pest control; stain removals; fabric washing; and other hygiene products under the Air Wick, Calgon, Cillit Bang, Finish, Harpic, Lysol, Mortein, Vanish, and Woolite brands, as well as analgesics, adult nutrition products, iron-fortified hypoallergenic baby formula, products for joint issues, and infant and toddler nutrition products, as well as vitamins, minerals, and supplements under the Biofreeze, Airborne, Mead Johnson, Move Free, Enfamil, and Nutramigen brands. Further, it provides probiotics, sore throat pain relief products, Omega products, brain health support products, cleaning and carpet cleaning products, septic tank system treatment products, cough syrups, plant-based laundry products, probiotics, and lubricants under the Digestive Advantage, Cepacol, MegaRed, Neuriva, Easy-Off, RID-X, Delsym, Botanical Origin, Bodi-Ome, and K-Y brands. The company was founded in 1819 and is headquartered in Slough, the United Kingdom.
| Metric | 2023 | 2022 | 2021 | 2020 | 2019 | 2018 | 2017 | 2016 | 2015 | 2014 | 2013 | 2012 | 2011 | 2010 | 2009 | 2008 | 2007 | 2006 | 2005 | 2004 | 2003 | 2002 |
|---|---|---|---|---|---|---|---|---|---|---|---|---|---|---|---|---|---|---|---|---|---|---|
| Revenue | 14.61B | 14.45B | 13.23B | 13.99B | 12.85B | 12.60B | 11.51B | 9.89B | 8.87B | 8.84B | 10.04B | 9.57B | 9.49B | 8.45B | 7.75B | 6.56B | 5.27B | 4.92B | 4.18B | 3.87B | 3.71B | 3.45B |
| Cost of Revenue | 5.85B | 6.09B | 5.56B | 5.56B | 5.07B | 4.96B | 4.64B | 3.87B | 3.63B | 3.74B | 4.07B | 4.03B | 3.82B | 3.33B | 3.09B | 2.67B | 2.20B | 2.13B | 1.89B | 1.75B | 1.74B | 1.68B |
| Gross Profit | 8.76B | 8.36B | 7.68B | 8.44B | 7.78B | 7.64B | 6.87B | 6.03B | 5.25B | 5.10B | 5.97B | 5.54B | 5.66B | 5.12B | 4.66B | 3.89B | 3.07B | 2.79B | 2.29B | 2.12B | 1.98B | 1.78B |
| Gross Profit Ratio | 59.97% | 57.85% | 58.00% | 60.28% | 60.55% | 60.61% | 59.68% | 60.92% | 59.12% | 57.67% | 59.43% | 57.88% | 59.69% | 60.58% | 60.16% | 59.27% | 58.30% | 56.66% | 54.87% | 54.79% | 53.27% | 51.42% |
| Research & Development | 337.00M | 325.00M | 313.00M | 288.00M | 257.00M | 223.00M | 187.00M | 149.00M | 140.00M | 146.00M | 199.00M | 171.00M | 26.00M | 33.00M | 119.00M | 102.00M | 88.00M | 82.00M | 63.00M | 66.00M | 57.00M | 54.00M |
| General & Administrative | 1.38B | 1.21B | 1.19B | 1.39B | 740.00M | 890.00M | 728.00M | 648.00M | 575.00M | 528.00M | 692.00M | 491.00M | 578.00M | 0.00 | 0.00 | 0.00 | 0.00 | 313.00M | 0.00 | 0.00 | 0.00 | 0.00 |
| Selling & Marketing | 3.70B | 3.44B | 3.46B | 3.61B | 3.42B | 3.17B | 3.00B | 2.46B | 2.17B | 2.25B | 2.47B | 2.32B | 2.30B | 0.00 | 2.10B | 1.84B | 1.50B | 0.00 | 0.00 | 0.00 | 0.00 | 0.00 |
| SG&A | 5.09B | 4.64B | 4.65B | 5.00B | 4.16B | 4.06B | 3.72B | 3.11B | 2.74B | 2.78B | 3.16B | 2.81B | 2.88B | 0.00 | 2.10B | 1.84B | 1.50B | 313.00M | 0.00 | 0.00 | 0.00 | 0.00 |
| Other Expenses | 807.00M | 158.00M | -1.00M | -2.00M | 202.00M | 0.00 | 0.00 | 59.00M | 0.00 | 0.00 | 0.00 | 0.00 | 0.00 | 0.00 | 0.00 | 0.00 | 0.00 | 0.00 | 0.00 | 0.00 | 0.00 | 0.00 |
| Operating Expenses | 6.23B | 5.13B | 4.96B | 5.29B | 4.62B | 4.59B | 4.13B | 3.62B | 3.01B | 2.93B | 3.62B | 3.10B | 3.28B | 3.02B | 2.77B | 2.38B | 1.94B | 1.72B | 1.45B | 1.36B | 1.29B | 1.19B |
| Cost & Expenses | 12.08B | 11.22B | 10.52B | 10.85B | 9.68B | 9.55B | 8.78B | 7.48B | 6.63B | 6.67B | 7.70B | 7.13B | 7.10B | 6.36B | 5.86B | 5.05B | 4.13B | 3.86B | 3.34B | 3.11B | 3.03B | 2.87B |
| Interest Income | 6.00M | 29.00M | 29.00M | 77.00M | 161.00M | 78.00M | 60.00M | 42.00M | 21.00M | 27.00M | 25.00M | 26.00M | 23.00M | 21.00M | 17.00M | 31.00M | 22.00M | 17.00M | 32.00M | 12.00M | 24.00M | 20.00M |
| Interest Expense | 295.00M | 257.00M | 244.00M | 363.00M | 314.00M | 403.00M | 298.00M | 58.00M | 54.00M | 65.00M | 56.00M | 41.00M | 38.00M | 12.00M | 16.00M | 62.00M | 46.00M | 53.00M | 13.00M | 27.00M | 43.00M | 52.00M |
| Depreciation & Amortization | 470.00M | 604.00M | 429.00M | 470.00M | 436.00M | 404.00M | 268.00M | 227.00M | 171.00M | 161.00M | 171.00M | 148.00M | 157.00M | 144.00M | 139.00M | 107.00M | 93.00M | 97.00M | 91.00M | 94.00M | 84.00M | 82.00M |
| EBITDA | 3.17B | 3.90B | 465.00M | 3.61B | 3.78B | 3.48B | 2.98B | 2.64B | 2.42B | 2.34B | 2.05B | 2.61B | 2.56B | 2.26B | 2.05B | 1.65B | 1.35B | 1.02B | 980.00M | 879.00M | 792.00M | 679.00M |
| EBITDA Ratio | 21.67% | 27.23% | 29.99% | 32.89% | 29.89% | 27.59% | 26.23% | 26.64% | 27.42% | 26.62% | 25.30% | 27.27% | 27.05% | 26.77% | 26.40% | 25.11% | 23.76% | 23.93% | 23.00% | 22.37% | 21.55% | 19.83% |
| Operating Income | 2.53B | 3.25B | 3.49B | 3.15B | -1.71B | 3.05B | 2.74B | 2.41B | 2.24B | 2.16B | 2.35B | 2.44B | 2.40B | 2.13B | 1.89B | 1.51B | 1.23B | 910.00M | 840.00M | 749.00M | 679.00M | 576.00M |
| Operating Income Ratio | 17.33% | 22.48% | 26.36% | 22.48% | -13.34% | 24.19% | 23.78% | 24.37% | 25.25% | 24.49% | 23.35% | 25.45% | 25.25% | 25.20% | 24.39% | 22.93% | 23.40% | 18.49% | 20.10% | 19.35% | 18.29% | 16.68% |
| Total Other Income/Expenses | -130.00M | -182.00M | 544.00M | -1.27B | -153.00M | -338.00M | -238.00M | -16.00M | -33.00M | -38.00M | -31.00M | -150.00M | -19.00M | 6.00M | 1.00M | -31.00M | -24.00M | -36.00M | 36.00M | 9.00M | -19.00M | -31.00M |
| Income Before Tax | 2.40B | 3.07B | -260.00M | 1.87B | -2.11B | 2.72B | 2.50B | 2.39B | 2.21B | 2.13B | 2.31B | 2.42B | 2.38B | 2.14B | 1.89B | 1.47B | 1.21B | 874.00M | 876.00M | 758.00M | 660.00M | 545.00M |
| Income Before Tax Ratio | 16.44% | 21.22% | -1.96% | 13.39% | -16.40% | 21.61% | 21.71% | 24.20% | 24.88% | 24.06% | 23.04% | 25.30% | 25.05% | 25.27% | 24.40% | 22.46% | 22.95% | 17.76% | 20.96% | 19.58% | 17.78% | 15.78% |
| Income Tax Expense | 753.00M | 711.00M | -208.00M | 720.00M | 665.00M | 536.00M | -894.00M | 558.00M | 463.00M | 462.00M | 574.00M | 587.00M | 622.00M | 566.00M | 474.00M | 354.00M | 271.00M | 200.00M | 207.00M | 181.00M | 171.00M | 137.00M |
| Net Income | 1.64B | 2.33B | -52.00M | 1.19B | -2.77B | 2.16B | 6.17B | 1.83B | 1.74B | 3.22B | 1.74B | 1.82B | 1.75B | 1.57B | 1.42B | 1.12B | 938.00M | 674.00M | 669.00M | 577.00M | 489.00M | 408.00M |
| Net Income Ratio | 11.25% | 16.12% | -0.39% | 8.48% | -21.58% | 17.14% | 53.61% | 18.52% | 19.64% | 36.48% | 17.32% | 19.03% | 18.40% | 18.55% | 18.29% | 17.07% | 17.80% | 13.69% | 16.01% | 14.91% | 13.17% | 11.81% |
| EPS | 2.27 | 3.27 | -0.07 | 1.67 | -3.91 | 3.06 | 8.79 | 2.60 | 2.44 | 4.47 | 2.42 | 2.51 | 2.40 | 2.17 | 1.99 | 1.58 | 1.31 | 0.94 | 0.92 | 0.81 | 0.69 | 0.58 |
| EPS Diluted | 2.29 | 3.26 | -0.07 | 1.66 | -3.91 | 3.05 | 8.68 | 2.57 | 2.41 | 4.41 | 2.38 | 2.48 | 2.37 | 2.14 | 1.95 | 1.55 | 1.28 | 0.92 | 0.90 | 0.77 | 0.66 | 0.56 |
| Weighted Avg Shares Out | 722.52M | 715.28M | 713.76M | 710.91M | 708.69M | 705.90M | 702.38M | 704.16M | 713.06M | 720.82M | 718.38M | 724.24M | 727.63M | 724.19M | 713.00M | 710.57M | 715.04M | 720.69M | 727.06M | 714.86M | 706.89M | 704.35M |
| Weighted Avg Shares Out (Dil) | 718.28M | 717.49M | 713.76M | 713.75M | 708.69M | 709.00M | 711.12M | 714.30M | 723.55M | 730.74M | 729.05M | 733.00M | 735.83M | 733.30M | 728.17M | 724.11M | 733.63M | 734.20M | 743.26M | 754.55M | 758.10M | 756.53M |

U.K. Top 40 Quality Dividend Stocks: Q2 2024
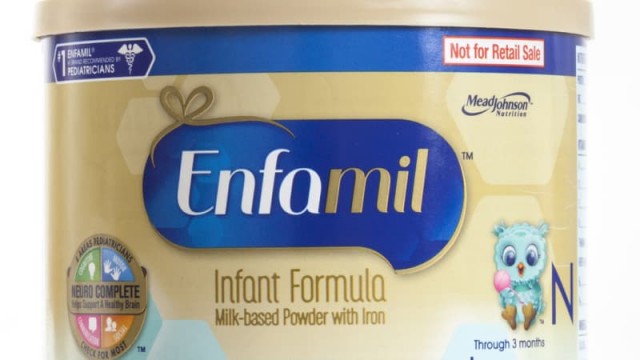
Reckitt Benckiser sees modest bounce following $7.1 billion market-cap wipeout

Enfamil maker vows to fight $60 million baby-formula verdict

Reckitt Benckiser Group plc (RBGPF) Q4 2023 Earnings Call Transcript
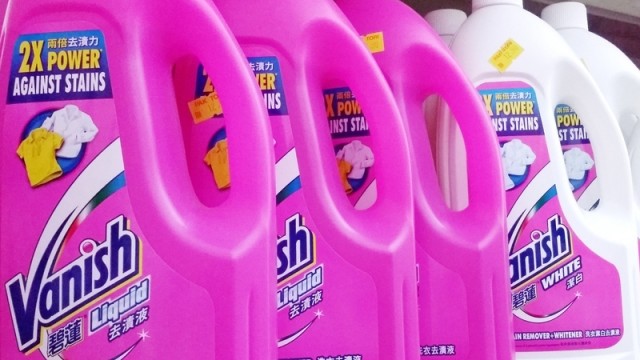
Reckitt Benckiser shares drop 11% after sales miss and Middle East 'compliance issues'

Just Eat, Reckitt Benckiser, Taylor Wimpey in focus on Wednesday
Reckitt Benckiser: Undervalued With Sound Growth Prospects
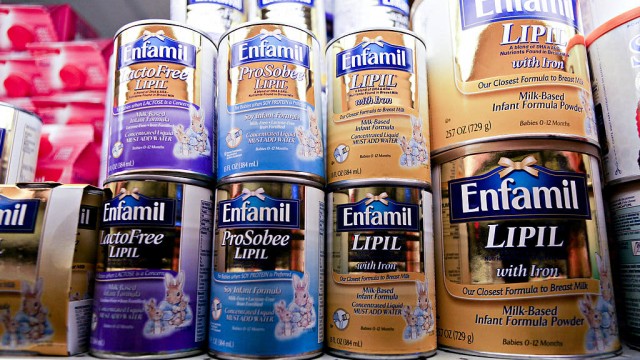
Reckitt Benckiser unit recalls possibly contaminated baby formula powder, FDA says
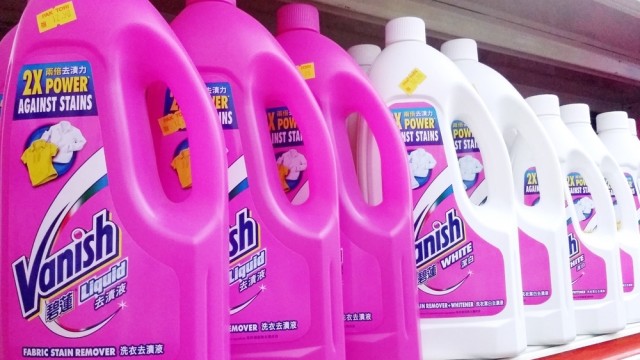
Reckitt Benckiser forecasts trimmed by US influential investment bank
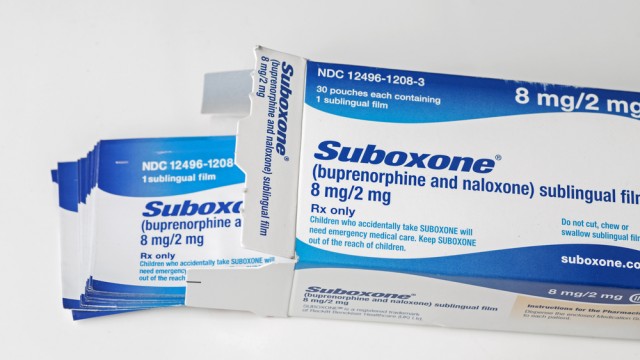
Indivior, Reckitt Benckiser win round one of high court battle over Suboxone anti-opioid claim
Source: https://incomestatements.info
Category: Stock Reports
