See more : SAMCO Inc. (6387.T) Income Statement Analysis – Financial Results
Complete financial analysis of Rheinmetall AG (RNMBF) income statement, including revenue, profit margins, EPS and key performance metrics. Get detailed insights into the financial performance of Rheinmetall AG, a leading company in the Aerospace & Defense industry within the Industrials sector.
- ASX Limited (ASXFY) Income Statement Analysis – Financial Results
- Powerlock International Corp. (PWLK) Income Statement Analysis – Financial Results
- Divi’s Laboratories Limited (DIVISLAB.BO) Income Statement Analysis – Financial Results
- Gujarat State Financial Corporation (GUJSTATFIN.BO) Income Statement Analysis – Financial Results
- Samaiden Group Bhd (0223.KL) Income Statement Analysis – Financial Results
Rheinmetall AG (RNMBF)
Industry: Aerospace & Defense
Sector: Industrials
Website: https://www.rheinmetall.com/en/rheinmetall_ag/home.php
About Rheinmetall AG
Rheinmetall AG provides technologies to the mobility and security sectors worldwide. The company operates in five segments: Vehicle Systems, Weapon and Ammunition, Electronic Solutions, Sensors and Actuators, and Materials and Trade. The Vehicle Systems segment offers combat, support, logistics, and special vehicles, including armored tracked vehicles, CBRN protection systems, turret systems, and wheeled logistics and tactical vehicles. The Weapon and Ammunition segment provides threat-appropriate, effective and accurate firepower, and protection solutions, such as large and medium-caliber weapons and ammunition, weapon stations, protection systems, and propellants and powders. The Electronic Solutions segment offers a chain of systems network, such as sensors, networking platforms, automated connected effectors for soldiers, and cyberspace protection solutions, and training and simulation solutions. Its products include air defense systems; soldier systems; command, control, and reconnaissance systems; fire control systems; sensors; and simulations for the army, air force, navy, and civil applications. The Sensors and Actuators segment provides a portfolio of products comprising exhaust gas recirculation systems; throttle valves, control dampers, and exhaust flaps for electromotors; solenoid valves; actuators and valve train systems; oil, water, and vacuum pumps for passenger cars, commercial vehicles, and light and heavy-duty off-road applications; and industrial solutions. The Materials and Trade segment focuses on the development of system components for the basic motors, such as engine blocks, structural components, and cylinder heads; plain bearings, and bushes; and replacement parts. It also engages in the aftermarket activities. The company was formerly known as Rheinmetall Berlin AG and changed its name to Rheinmetall AG in 1996. Rheinmetall AG was founded in 1889 and is headquartered in Düsseldorf, Germany.
| Metric | 2023 | 2022 | 2021 | 2020 | 2019 | 2018 | 2017 | 2016 | 2015 | 2014 | 2013 | 2012 | 2011 | 2010 | 2009 | 2008 | 2007 | 2006 | 2005 | 2004 | 2003 | 2002 |
|---|---|---|---|---|---|---|---|---|---|---|---|---|---|---|---|---|---|---|---|---|---|---|
| Revenue | 7.18B | 6.41B | 5.66B | 5.88B | 6.26B | 6.15B | 5.90B | 5.60B | 5.18B | 4.69B | 4.61B | 4.70B | 4.45B | 3.99B | 3.42B | 3.93B | 4.01B | 3.63B | 3.45B | 3.41B | 4.25B | 4.57B |
| Cost of Revenue | 3.24B | 3.03B | 2.63B | 2.93B | 3.21B | 3.17B | 3.15B | 3.01B | 2.78B | 2.55B | 2.43B | 2.46B | 2.24B | 1.99B | 1.63B | 2.01B | -2.12B | -1.84B | -1.67B | -1.61B | 2.01B | 2.08B |
| Gross Profit | 3.94B | 3.38B | 3.03B | 2.95B | 3.05B | 2.98B | 2.75B | 2.59B | 2.40B | 2.14B | 2.18B | 2.25B | 2.21B | 2.00B | 1.79B | 1.92B | 6.12B | 5.47B | 5.12B | 5.03B | 2.23B | 2.49B |
| Gross Profit Ratio | 54.86% | 52.71% | 53.55% | 50.13% | 48.71% | 48.52% | 46.62% | 46.25% | 46.29% | 45.71% | 47.28% | 47.77% | 49.71% | 50.14% | 52.43% | 48.94% | 152.81% | 150.77% | 148.35% | 147.29% | 52.59% | 54.56% |
| Research & Development | 0.00 | 351.00M | 337.00M | 343.00M | 355.00M | 336.00M | 295.00M | 216.00M | 239.00M | 222.00M | 213.00M | 191.00M | 0.00 | 0.00 | 0.00 | 0.00 | 0.00 | 0.00 | 0.00 | 0.00 | 0.00 | 0.00 |
| General & Administrative | 147.00M | 125.00M | 65.00M | 82.00M | 79.00M | 76.00M | 79.00M | 125.00M | 121.00M | 101.00M | 106.00M | 226.00M | 1.26B | 1.18B | 0.00 | 1.08B | 1.05B | 0.00 | 0.00 | 0.00 | 1.34B | 1.45B |
| Selling & Marketing | 117.00M | 109.00M | 93.00M | 81.00M | 99.00M | 106.00M | 97.00M | 97.00M | 95.00M | 99.00M | 82.00M | 91.00M | 91.00M | 0.00 | 0.00 | 0.00 | -87.00M | -75.00M | -86.00M | -100.00M | 0.00 | 0.00 |
| SG&A | 264.00M | 234.00M | 158.00M | 163.00M | 178.00M | 182.00M | 176.00M | 222.00M | 216.00M | 200.00M | 188.00M | 317.00M | 1.26B | 1.18B | 0.00 | 1.08B | -87.00M | -75.00M | -86.00M | -100.00M | 1.34B | 1.45B |
| Other Expenses | 3.67B | 6.00M | 6.00M | 6.00M | 11.00M | 11.00M | 11.00M | 9.00M | 10.00M | 7.00M | 5.00M | 5.00M | 22.00M | 0.00 | 2.00M | -120.00M | 0.00 | 0.00 | 0.00 | 0.00 | 0.00 | 0.00 |
| Operating Expenses | 3.94B | 2.63B | 2.41B | 2.57B | 2.57B | 2.54B | 2.34B | 2.20B | 2.09B | 2.07B | 2.02B | 2.00B | 1.88B | 1.72B | 1.73B | 1.68B | -87.00M | -75.00M | -86.00M | -100.00M | 2.03B | 2.10B |
| Cost & Expenses | 6.28B | 5.66B | 5.04B | 5.50B | 5.77B | 5.70B | 5.49B | 5.22B | 4.87B | 4.62B | 4.45B | 4.45B | 4.12B | 3.71B | 3.36B | 3.68B | -2.20B | -1.92B | -1.76B | -1.71B | 4.04B | 4.18B |
| Interest Income | 29.00M | 12.00M | 4.00M | 9.00M | 11.00M | 6.00M | 9.00M | 5.00M | 3.00M | 2.00M | 2.00M | 4.00M | 18.00M | 19.00M | 2.00M | 62.00M | 57.00M | 0.00 | 0.00 | 0.00 | 84.00M | 102.00M |
| Interest Expense | 111.00M | 32.00M | 31.00M | 42.00M | 46.00M | 39.00M | 48.00M | 59.00M | 69.00M | 82.00M | 79.00M | 66.00M | 65.00M | 68.00M | 61.00M | 2.00M | 7.00M | 0.00 | 0.00 | 0.00 | 2.00M | 2.00M |
| Depreciation & Amortization | 308.00M | 249.00M | 237.00M | 250.00M | 278.00M | 275.00M | 220.00M | 227.00M | 203.00M | 208.00M | 212.00M | 194.00M | 184.00M | 167.00M | 165.00M | 166.00M | 168.00M | 151.00M | 157.00M | 168.00M | 238.00M | 309.00M |
| EBITDA | 1.23B | 1.00B | 867.00M | 710.00M | 801.00M | 807.00M | 605.00M | 585.00M | 493.00M | 312.00M | 337.00M | 494.00M | 520.00M | 445.00M | 180.00M | 293.00M | 388.00M | 2.07B | 1.91B | 1.88B | 364.00M | 601.00M |
| EBITDA Ratio | 17.20% | 15.65% | 15.52% | 14.47% | 12.81% | 13.13% | 10.26% | 10.44% | 9.42% | 6.78% | 8.82% | 10.12% | 11.67% | 11.63% | 6.67% | 8.96% | 59.18% | 57.00% | 55.39% | 55.14% | 8.57% | 13.15% |
| Operating Income | 846.00M | 754.00M | 624.00M | 293.00M | 521.00M | 489.00M | 385.00M | 353.00M | 275.00M | 77.00M | 81.00M | 283.00M | 336.00M | 278.00M | 13.00M | 244.00M | 263.00M | 213.00M | 227.00M | 202.00M | 206.00M | 394.00M |
| Operating Income Ratio | 11.79% | 11.76% | 11.03% | 4.99% | 8.33% | 7.95% | 6.53% | 6.30% | 5.31% | 1.64% | 1.76% | 6.02% | 7.54% | 6.97% | 0.38% | 6.21% | 6.57% | 5.87% | 6.57% | 5.92% | 4.85% | 8.62% |
| Total Other Income/Expenses | -31.00M | -18.00M | -43.00M | -62.00M | -5.00M | 37.00M | -38.00M | -53.00M | -54.00M | -55.00M | -94.00M | -67.00M | -41.00M | -49.00M | -59.00M | -50.00M | -50.00M | -213.00M | -227.00M | -202.00M | -86.00M | -104.00M |
| Income Before Tax | 815.00M | 711.00M | 582.00M | 57.00M | 477.00M | 485.00M | 346.00M | 299.00M | 221.00M | 22.00M | 35.00M | 239.00M | 295.00M | 229.00M | -46.00M | 184.00M | 213.00M | 0.00 | 0.00 | 0.00 | 120.00M | 290.00M |
| Income Before Tax Ratio | 11.36% | 11.09% | 10.29% | 0.97% | 7.63% | 7.89% | 5.87% | 5.34% | 4.26% | 0.47% | 0.76% | 5.08% | 6.62% | 5.74% | -1.35% | 4.69% | 5.32% | 0.00% | 0.00% | 0.00% | 2.82% | 6.34% |
| Income Tax Expense | 185.00M | 183.00M | 150.00M | 56.00M | 123.00M | 131.00M | 94.00M | 84.00M | 61.00M | 6.00M | 13.00M | 49.00M | 70.00M | 55.00M | 6.00M | 49.00M | 2.06B | 1.80B | 1.64B | 1.62B | 52.00M | 16.00M |
| Net Income | 535.00M | 474.00M | 291.00M | -27.00M | 335.00M | 305.00M | 224.00M | 200.00M | 151.00M | 18.00M | 29.00M | 173.00M | 213.00M | 162.00M | -52.00M | 141.00M | 145.00M | 120.00M | 113.00M | 96.00M | 63.00M | 246.00M |
| Net Income Ratio | 7.46% | 7.39% | 5.14% | -0.46% | 5.36% | 4.96% | 3.80% | 3.57% | 2.91% | 0.38% | 0.63% | 3.68% | 4.78% | 4.06% | -1.52% | 3.59% | 3.62% | 3.31% | 3.27% | 2.81% | 1.48% | 5.38% |
| EPS | 12.02 | 10.93 | 6.72 | -0.63 | 7.78 | 7.10 | 5.24 | 4.69 | 3.88 | 0.47 | 0.75 | 4.55 | 5.55 | 4.23 | -1.43 | 4.09 | 4.03 | 3.41 | 3.19 | 2.64 | 1.72 | 6.81 |
| EPS Diluted | 11.55 | 10.93 | 6.72 | -0.63 | 7.78 | 7.10 | 5.24 | 4.69 | 3.88 | 0.47 | 0.75 | 4.55 | 5.55 | 4.23 | -1.43 | 4.09 | 4.03 | 3.41 | 3.19 | 2.64 | 1.72 | 6.81 |
| Weighted Avg Shares Out | 44.50M | 43.36M | 43.28M | 43.17M | 43.06M | 42.95M | 42.80M | 42.61M | 38.98M | 38.21M | 37.93M | 38.10M | 38.33M | 38.23M | 36.26M | 34.54M | 36.00M | 36.00M | 36.00M | 18.00M | 18.00M | 18.00M |
| Weighted Avg Shares Out (Dil) | 46.34M | 43.36M | 43.28M | 43.17M | 43.06M | 42.95M | 42.80M | 42.61M | 38.98M | 38.21M | 37.93M | 38.10M | 38.33M | 38.23M | 36.26M | 34.54M | 36.00M | 36.00M | 36.00M | 18.00M | 18.00M | 18.00M |
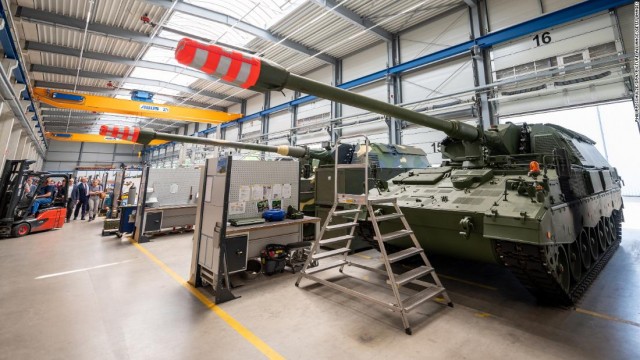
Rheinmetall will build and repair tanks in Ukraine, says CEO
General Dynamics, American Rheinmetall chosen to compete to win potential $45 bln US Army vehicle contract
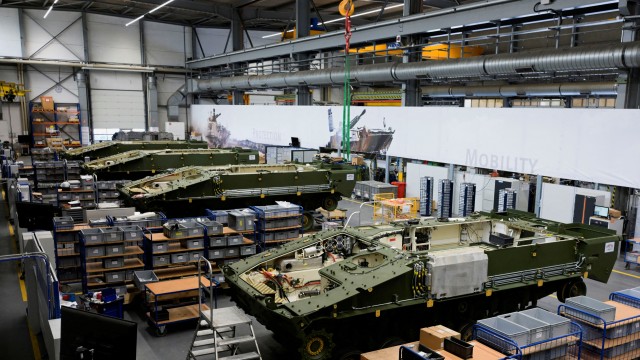
Rheinmetall to boost propellant powder production by up to 600 tons per year -CEO
Rheinmetall expects German ammunition order worth billions soon -CEO
Rheinmetall could be worth 17 bln euro over medium term-CEO

Rheinmetall AG (RNMBF) Q1 2023 Earnings Call Transcript
German armsmaker Rheinmetall suffers cyber attack
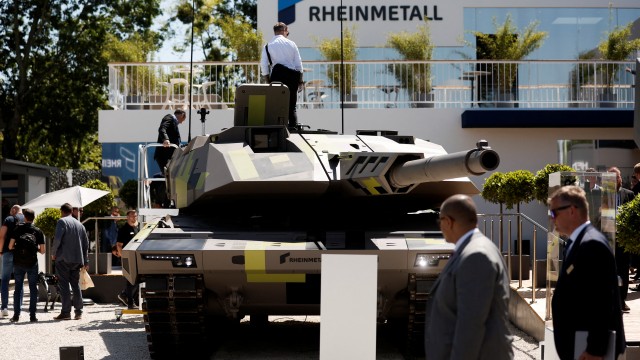
Rheinmetall in talks on building tank factory in Ukraine - report
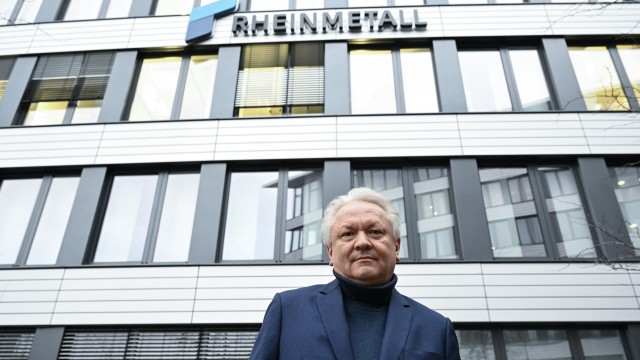
Rheinmetall moving towards order backlog of 30 billion euros - CEO
Rheinmetall eyes boost in munitions output, HIMARS production in Germany
Source: https://incomestatements.info
Category: Stock Reports
