See more : Best Eastern Hotels Limited (BESTEAST.BO) Income Statement Analysis – Financial Results
Complete financial analysis of Renault SA (RNSDF) income statement, including revenue, profit margins, EPS and key performance metrics. Get detailed insights into the financial performance of Renault SA, a leading company in the Auto – Manufacturers industry within the Consumer Cyclical sector.
- Identi Healthcare Ltd (IDNT.TA) Income Statement Analysis – Financial Results
- Khosla Ventures Acquisition Co. (KVSA) Income Statement Analysis – Financial Results
- Takara Bio Inc. (4974.T) Income Statement Analysis – Financial Results
- Monex, S.A.B. de C.V. (MONEXB.MX) Income Statement Analysis – Financial Results
- Ally Financial Inc. (ALLY) Income Statement Analysis – Financial Results
Renault SA (RNSDF)
About Renault SA
Renault SA designs, manufactures, sells, and distributes vehicles in France and internationally. The company operates through Automotive, AVTOVAZ, Sales Financing, and Mobility Services segments. It offers passenger and light commercial, and electric vehicles primarily under the Renault, Dacia, Renault Samsung Motors, Alpine, LADA, Jinbei & Huaasong, and Eveasy, as well as under the Nissan, Datsun, and Infiniti brands. The company also sells powertrains and used vehicles, and spare parts; and provides various services, including vehicle sales financing, rental, maintenance, and service contracts. In addition, it offers finance for the purchase on inventories of new and used vehicles, and replacement parts; designs, produces, and sells converted vehicles; Renault EASY CONNECT for Fleet, a connected service for business users; and produces driving aids, such as steering-wheel mounted accelerators and brakes, multifunction remote control units to operate indicators, lights and horns, pedal transfers, etc.; and manual or electric swivel seats. Renault SA was founded in 1898 and is based in Boulogne-Billancourt, France.
| Metric | 2023 | 2022 | 2021 | 2020 | 2019 | 2018 | 2017 | 2016 | 2015 | 2014 | 2013 | 2012 | 2011 | 2010 | 2009 | 2008 | 2007 | 2006 | 2005 | 2004 | 2003 | 2002 |
|---|---|---|---|---|---|---|---|---|---|---|---|---|---|---|---|---|---|---|---|---|---|---|
| Revenue | 52.38B | 46.39B | 46.21B | 43.48B | 55.54B | 57.42B | 58.77B | 51.24B | 45.33B | 41.06B | 40.93B | 41.27B | 42.63B | 38.97B | 33.71B | 37.79B | 40.68B | 41.53B | 41.34B | 40.72B | 37.53B | 36.34B |
| Cost of Revenue | 41.48B | 37.15B | 37.53B | 36.26B | 44.67B | 45.42B | 46.48B | 40.26B | 36.11B | 33.31B | 33.61B | 34.09B | 34.76B | 31.43B | 27.93B | 30.95B | 32.53B | 33.48B | 33.06B | 32.33B | 30.43B | 29.35B |
| Gross Profit | 10.90B | 9.25B | 8.69B | 7.22B | 10.87B | 12.00B | 12.29B | 10.99B | 9.21B | 7.75B | 7.32B | 7.18B | 7.87B | 7.54B | 5.78B | 6.84B | 8.15B | 8.04B | 8.28B | 8.38B | 7.10B | 6.99B |
| Gross Profit Ratio | 20.81% | 19.93% | 18.80% | 16.60% | 19.58% | 20.90% | 20.92% | 21.44% | 20.33% | 18.86% | 17.89% | 17.39% | 18.46% | 19.34% | 17.15% | 18.10% | 20.04% | 19.37% | 20.02% | 20.59% | 18.91% | 19.23% |
| Research & Development | 2.14B | 2.13B | 2.37B | 2.57B | 2.66B | 2.60B | 2.59B | 2.37B | 2.08B | 1.72B | 1.81B | 1.92B | 2.03B | 1.83B | 1.80B | 1.86B | 1.85B | 1.96B | 2.03B | 1.38B | 1.24B | 1.14B |
| General & Administrative | 4.70B | 4.52B | 4.47B | 4.99B | 5.55B | 5.79B | 5.85B | 5.34B | 4.82B | 4.42B | 4.27B | 4.53B | 4.75B | 4.61B | 4.38B | 4.77B | 4.95B | 5.02B | 4.92B | 4.58B | 4.45B | 4.36B |
| Selling & Marketing | 42.00M | 4.53B | 4.66B | 4.99B | 5.55B | 5.79B | 5.85B | 5.34B | 4.82B | 4.42B | 4.27B | 4.53B | 4.75B | 0.00 | 0.00 | 0.00 | 0.00 | 0.00 | 0.00 | 0.00 | 0.00 | 0.00 |
| SG&A | 4.74B | 4.53B | 4.66B | 4.99B | 5.55B | 5.79B | 5.85B | 5.34B | 4.82B | 4.42B | 4.27B | 4.53B | 4.75B | 4.61B | 4.38B | 4.77B | 4.95B | 5.02B | 4.92B | 4.58B | 4.45B | 4.36B |
| Other Expenses | 1.53B | 0.00 | 0.00 | 0.00 | 0.00 | 0.00 | 0.00 | 0.00 | 0.00 | 0.00 | 0.00 | 0.00 | 0.00 | 0.00 | 0.00 | 0.00 | 0.00 | 0.00 | 0.00 | 0.00 | 0.00 | 0.00 |
| Operating Expenses | 8.41B | 6.58B | 7.20B | 7.77B | 8.29B | 8.45B | 8.48B | 7.71B | 6.91B | 6.20B | 6.08B | 6.69B | 6.63B | 6.90B | 6.74B | 6.96B | 6.92B | 7.17B | 6.76B | 6.23B | 5.86B | 5.77B |
| Cost & Expenses | 49.89B | 43.73B | 44.72B | 44.02B | 52.95B | 53.87B | 54.96B | 47.96B | 43.02B | 39.51B | 39.69B | 40.78B | 41.38B | 38.34B | 34.67B | 37.91B | 39.44B | 40.65B | 39.82B | 38.57B | 36.29B | 35.12B |
| Interest Income | 224.00M | 168.00M | 73.00M | 18.00M | 75.00M | 65.00M | 72.00M | 101.00M | 162.00M | 216.00M | 183.00M | 184.00M | 193.00M | 146.00M | 118.00M | 157.00M | 274.00M | 223.00M | 153.00M | 128.00M | 58.00M | 88.00M |
| Interest Expense | 368.00M | 370.00M | 392.00M | 371.00M | 414.00M | 398.00M | 466.00M | 417.00M | 422.00M | 543.00M | 492.00M | 461.00M | 412.00M | 500.00M | 471.00M | 373.00M | 375.00M | 333.00M | 248.00M | 22.00M | 129.00M | 179.00M |
| Depreciation & Amortization | 3.19B | 5.54B | 3.90B | 3.99B | 3.57B | 2.97B | 3.05B | 2.77B | 2.73B | 2.71B | 3.17B | 3.31B | 2.83B | 3.07B | 3.15B | 2.94B | 2.87B | 2.84B | 2.71B | 2.27B | 2.22B | 2.07B |
| EBITDA | 6.39B | 6.03B | 5.33B | -1.02B | 5.70B | 7.82B | 9.73B | 7.86B | 6.48B | 5.28B | 4.79B | 6.04B | 5.89B | 7.12B | 697.00M | 4.08B | 6.23B | 6.38B | 6.74B | 6.37B | 5.38B | 4.70B |
| EBITDA Ratio | 12.21% | 14.65% | 13.33% | -2.34% | 11.18% | 14.64% | 16.37% | 15.33% | 14.58% | 14.19% | 14.81% | 13.32% | 13.82% | 18.26% | 2.07% | 10.79% | 15.31% | 15.33% | 16.30% | 16.06% | 14.32% | 12.94% |
| Operating Income | 2.49B | 2.22B | 1.40B | -2.00B | 2.11B | 2.99B | 3.81B | 3.28B | 2.12B | 1.11B | -34.00M | 122.00M | 1.24B | 635.00M | -955.00M | -117.00M | 1.24B | 877.00M | 1.51B | 2.15B | 1.23B | 1.22B |
| Operating Income Ratio | 4.74% | 4.78% | 3.03% | -4.60% | 3.79% | 5.20% | 6.48% | 6.41% | 4.68% | 2.69% | -0.08% | 0.30% | 2.92% | 1.63% | -2.83% | -0.31% | 3.04% | 2.11% | 3.66% | 5.28% | 3.29% | 3.35% |
| Total Other Income/Expenses | 353.00M | -63.00M | 663.00M | -5.63B | -632.00M | 1.19B | 2.30B | 1.32B | 1.10B | 1.03B | 1.16B | 2.16B | 1.40B | 2.91B | -1.97B | 878.00M | 1.75B | 2.32B | 2.27B | 1.59B | 1.79B | 1.24B |
| Income Before Tax | 2.84B | 2.15B | 1.56B | -7.63B | 1.47B | 4.17B | 6.10B | 4.60B | 3.27B | 2.13B | 1.13B | 2.28B | 2.65B | 3.55B | -2.92B | 761.00M | 2.99B | 3.20B | 3.78B | 4.25B | 3.02B | 2.46B |
| Income Before Tax Ratio | 5.42% | 4.64% | 3.38% | -17.54% | 2.65% | 7.27% | 10.38% | 8.97% | 7.22% | 5.20% | 2.76% | 5.53% | 6.21% | 9.10% | -8.66% | 2.01% | 7.35% | 7.70% | 9.15% | 10.44% | 8.06% | 6.76% |
| Income Tax Expense | 523.00M | 533.00M | 596.00M | 420.00M | 1.45B | 723.00M | 891.00M | 1.06B | 311.00M | 136.00M | 433.00M | 549.00M | 508.00M | 58.00M | 148.00M | 162.00M | 255.00M | 255.00M | 331.00M | 634.00M | 510.00M | 447.00M |
| Net Income | 2.20B | -338.00M | 888.00M | -8.01B | -141.00M | 3.30B | 5.21B | 3.42B | 2.82B | 1.89B | 586.00M | 1.77B | 2.09B | 3.42B | -3.07B | 571.00M | 2.67B | 2.89B | 3.37B | 2.84B | 2.48B | 1.96B |
| Net Income Ratio | 4.20% | -0.73% | 1.92% | -18.42% | -0.25% | 5.75% | 8.87% | 6.67% | 6.23% | 4.60% | 1.43% | 4.29% | 4.91% | 8.78% | -9.10% | 1.51% | 6.56% | 6.95% | 8.15% | 6.97% | 6.61% | 5.38% |
| EPS | 7.99 | -1.24 | 3.26 | -29.51 | -0.52 | 12.24 | 19.23 | 12.57 | 10.35 | 6.92 | 2.15 | 6.51 | 7.68 | 12.70 | -11.91 | 2.23 | 10.32 | 11.23 | 13.19 | 11.16 | 9.32 | 7.53 |
| EPS Diluted | 7.99 | -1.24 | 3.24 | -29.51 | -0.52 | 12.13 | 19.04 | 12.46 | 10.29 | 6.90 | 2.14 | 6.50 | 7.68 | 12.70 | -11.91 | 2.22 | 10.17 | 11.10 | 13.08 | 11.10 | 9.32 | 7.53 |
| Weighted Avg Shares Out | 275.09M | 272.10M | 272.10M | 271.35M | 271.64M | 269.85M | 271.08M | 271.97M | 272.71M | 273.05M | 272.29M | 272.26M | 272.38M | 269.29M | 257.51M | 256.55M | 258.62M | 256.99M | 255.18M | 254.17M | 265.96M | 259.56M |
| Weighted Avg Shares Out (Dil) | 275.14M | 272.10M | 273.87M | 271.35M | 271.64M | 272.22M | 273.75M | 274.33M | 274.31M | 273.95M | 274.10M | 272.39M | 272.38M | 269.29M | 257.51M | 256.81M | 262.36M | 260.09M | 257.34M | 255.44M | 265.96M | 259.56M |
Renault capital hit from partial Nissan stake sale lower than initial estimate
Renault to sell first tranche of Nissan stake, booking 1.5 bln euro loss
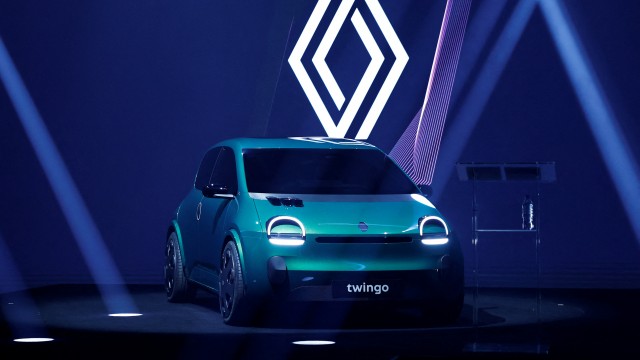
Renault to pick partner for new Twingo EV by early 2024 -sources

VW considering cooperation with Renault on 20,000-euro electric car - Handelsblatt

Renault hopes to escape from its 'negative core value' curse
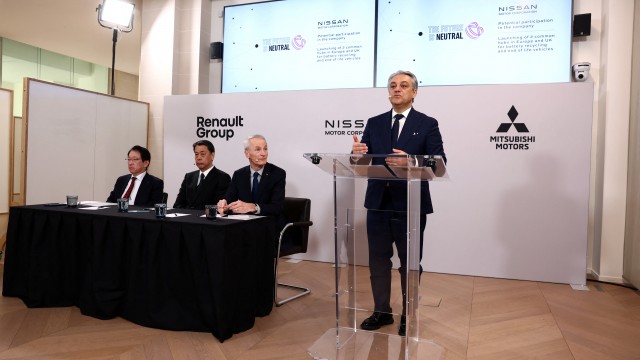
Nissan, Mitsubishi confirm investment plans in Renault EV unit
Renault's Ampere IPO is coming in 2024: Reasons to avoid the stock

Renault: Time To Buy More
Renault prepares to float EV subsidiary Ampere in 2024

Renault urges investors to back its new EV company Ampere in push to create European rival to Tesla
Source: https://incomestatements.info
Category: Stock Reports
