See more : Future Supply Chain Solutions Limited (FSC.NS) Income Statement Analysis – Financial Results
Complete financial analysis of Roadrunner Transportation Systems, Inc. (RRTS) income statement, including revenue, profit margins, EPS and key performance metrics. Get detailed insights into the financial performance of Roadrunner Transportation Systems, Inc., a leading company in the Trucking industry within the Industrials sector.
- Macbee Planet,Inc. (7095.T) Income Statement Analysis – Financial Results
- Daidong Electronics Co. Ltd. (008110.KS) Income Statement Analysis – Financial Results
- Trillium Therapeutics Inc. (TRIL.TO) Income Statement Analysis – Financial Results
- WithSecure Oyj (WITH.HE) Income Statement Analysis – Financial Results
- Navient Corporation (NAVI) Income Statement Analysis – Financial Results
Roadrunner Transportation Systems, Inc. (RRTS)
About Roadrunner Transportation Systems, Inc.
Roadrunner Transportation Systems, Inc. provides asset-right transportation and asset-light logistics services. It operates through four segments: Ascent Transportation Management (Ascent TM), Ascent On-Demand (Ascent OD), Less-than-Truckload (LTL), and Truckload (TL). The company offers domestic freight management solutions, including asset-backed truckload brokerage, specialized/heavy haul, LTL shipment execution, LTL carrier rate negotiations, access to its transportation management system, and freight audit/payment. It also provides air and ground expedite services for the transportation of automotive and industrial parts, paper products, and steel, as well as frozen and refrigerated foods, including dairy, poultry and meat, and consumers products, such as foods and beverages. In addition, the company arranges the pickup and delivery of TL freight through its 30 TL service centers in the United States; offers dry van truckload, temperature-controlled truckload, and logistics and warehouse services; and provides pickup, consolidation, linehaul, deconsolidation, and delivery of LTL shipments in the United States and Canada through 27 LTL service centers and approximately 140 third-party delivery agents. Further, the company provides international air and ocean freight forwarding, customs brokerage, regulatory compliance, project and order management, and retail consolidation services. It operates through a network of independent brokerage agents, direct sales force, company brokers, and commissioned sales representatives. The company offers its services under the Roadrunner and Ascent Global Logistics brands. Roadrunner Transportation Systems, Inc. was incorporated in 2005 and is headquartered in Downers Grove, Illinois.
| Metric | 2023 | 2022 | 2021 | 2020 | 2019 | 2018 | 2017 | 2016 | 2015 | 2014 | 2013 | 2012 | 2011 | 2010 | 2009 | 2008 |
|---|---|---|---|---|---|---|---|---|---|---|---|---|---|---|---|---|
| Revenue | 408.67M | 397.73M | 418.73M | 443.01M | 1.85B | 2.22B | 2.09B | 2.03B | 2.00B | 1.87B | 1.36B | 1.07B | 843.63M | 632.02M | 450.35M | 537.38M |
| Cost of Revenue | 360.67M | 361.52M | 390.24M | 423.54M | 1.62B | 1.87B | 1.77B | 1.69B | 1.61B | 1.53B | 1.11B | 882.91M | 620.34M | 494.05M | 354.07M | 432.14M |
| Gross Profit | 48.00M | 36.21M | 28.49M | 19.46M | 228.75M | 345.21M | 326.24M | 344.87M | 383.68M | 341.65M | 249.67M | 190.44M | 223.28M | 137.97M | 96.28M | 105.24M |
| Gross Profit Ratio | 11.74% | 9.10% | 6.80% | 4.39% | 12.38% | 15.58% | 15.60% | 16.96% | 19.23% | 18.24% | 18.34% | 17.74% | 26.47% | 21.83% | 21.38% | 19.58% |
| Research & Development | 0.00 | 0.00 | 0.00 | 0.00 | 0.00 | 0.00 | 0.00 | 0.00 | 0.00 | 0.00 | 0.00 | 0.00 | 0.00 | 0.00 | 0.00 | 0.00 |
| General & Administrative | 0.00 | 0.00 | 0.00 | 0.00 | 0.00 | 0.00 | 296.93M | 286.13M | 263.52M | 213.08M | 151.16M | 119.96M | 87.18M | 62.42M | 48.26M | 55.00M |
| Selling & Marketing | 0.00 | 0.00 | 0.00 | 0.00 | 0.00 | 0.00 | 0.00 | 0.00 | 0.00 | 0.00 | 0.00 | 0.00 | 0.00 | 0.00 | 0.00 | 0.00 |
| SG&A | 70.55M | 80.04M | 80.30M | 94.86M | 103.13M | 375.27M | 296.93M | 286.13M | 263.52M | 213.08M | 151.16M | 119.96M | 87.18M | 62.42M | 48.26M | 55.00M |
| Other Expenses | 0.00 | 0.00 | 0.00 | 0.00 | 370.21M | 397.47M | 96.81M | 88.85M | 22.92M | 1.78B | 1.28B | -49.00K | 602.25M | 602.25M | 0.00 | 0.00 |
| Operating Expenses | 70.55M | 80.04M | 80.30M | 94.86M | 370.21M | 397.47M | 393.73M | 374.98M | 286.44M | 243.66M | 163.45M | 120.72M | 175.78M | 106.70M | 83.08M | 94.54M |
| Cost & Expenses | 431.22M | 441.56M | 470.54M | 518.40M | 1.99B | 2.27B | 2.16B | 2.06B | 1.90B | 1.77B | 1.28B | 1.00B | 796.12M | 600.75M | 437.15M | 526.68M |
| Interest Income | 0.00 | 0.00 | 0.00 | 0.00 | 20.41K | 0.00 | 0.00 | 0.00 | 0.00 | 0.00 | 0.00 | 0.00 | 0.00 | 200.00K | 0.00 | 0.00 |
| Interest Expense | 7.33M | 3.83M | 3.88M | 9.54M | 20.41M | 116.91M | 64.05M | 22.83M | 19.44M | 13.36M | 7.88M | 7.98M | 4.14M | 8.15M | 12.53M | 12.35M |
| Depreciation & Amortization | 6.86M | 7.14M | 11.16M | 14.31M | 15.10M | 42.77M | 37.75M | 38.15M | 34.61M | 27.15M | 18.49M | 11.11M | 5.63M | 3.82M | 3.09M | 2.44M |
| EBITDA | -15.69M | -36.69M | -41.02M | -94.03M | -265.18M | -26.96M | -13.45M | -365.63M | 94.00M | 90.57M | 101.67M | 80.06M | 53.13M | 17.67M | 16.29M | 13.14M |
| EBITDA Ratio | -3.84% | -9.22% | -9.71% | -13.79% | -4.42% | -0.39% | -1.37% | 0.52% | 4.87% | 5.23% | 6.33% | 6.49% | 6.30% | 5.55% | 3.62% | 2.44% |
| Operating Income | -22.55M | -43.83M | -51.81M | -75.40M | -141.46M | -58.50M | -36.45M | -403.77M | 96.67M | 95.69M | 85.36M | 68.95M | 46.14M | 29.77M | 13.20M | 7.28M |
| Operating Income Ratio | -5.52% | -11.02% | -12.37% | -17.02% | -7.66% | -2.64% | -1.74% | -19.86% | 4.85% | 5.11% | 6.27% | 6.42% | 5.47% | 4.71% | 2.93% | 1.35% |
| Total Other Income/Expenses | -7.33M | -3.83M | -4.26M | -42.48M | -22.68M | -116.91M | -79.93M | -22.83M | -19.44M | -13.36M | -7.88M | -8.03M | -5.70M | -24.07M | -13.43M | -12.55M |
| Income Before Tax | -29.88M | -47.66M | -56.07M | -117.87M | -344.60M | -175.41M | -116.38M | -426.60M | 77.23M | 82.32M | 77.48M | 60.92M | 41.80M | 5.70M | 471.00K | -5.27M |
| Income Before Tax Ratio | -7.31% | -11.98% | -13.39% | -26.61% | -18.65% | -7.92% | -5.56% | -20.98% | 3.87% | 4.40% | 5.69% | 5.68% | 4.95% | 0.90% | 0.10% | -0.98% |
| Income Tax Expense | 71.00K | 58.00K | -10.00K | -14.75M | -3.66M | -9.81M | -25.19M | -66.28M | 29.23M | 30.35M | 28.48M | 23.39M | 15.93M | 2.11M | 304.00K | -1.44M |
| Net Income | -29.95M | -47.72M | -56.06M | -142.24M | -340.94M | -165.60M | -91.19M | -360.32M | 48.00M | 51.97M | 49.00M | 37.53M | 25.87M | 3.59M | 167.00K | -3.83M |
| Net Income Ratio | -7.33% | -12.00% | -13.39% | -32.11% | -18.45% | -7.47% | -4.36% | -17.72% | 2.41% | 2.78% | 3.60% | 3.50% | 3.07% | 0.57% | 0.04% | -0.71% |
| EPS | -0.78 | -1.25 | -1.46 | -3.72 | -9.00 | -107.39 | -59.37 | -235.09 | 31.60 | 34.25 | 34.00 | 30.25 | 21.25 | 2.75 | -2.75 | -5.24 |
| EPS Diluted | -0.78 | -1.25 | -1.46 | -3.72 | -9.00 | -107.39 | -59.37 | -235.09 | 30.79 | 33.00 | 32.25 | 29.00 | 20.50 | 2.75 | -2.75 | -5.04 |
| Weighted Avg Shares Out | 38.29M | 38.31M | 38.29M | 38.26M | 37.87M | 1.54M | 1.54M | 1.53M | 1.52M | 1.51M | 1.45M | 1.24M | 1.22M | 1.03M | 706.24K | 731.00K |
| Weighted Avg Shares Out (Dil) | 38.29M | 38.31M | 38.29M | 38.26M | 37.87M | 1.54M | 1.54M | 1.53M | 1.56M | 1.57M | 1.52M | 1.30M | 1.26M | 1.07M | 706.24K | 760.92K |
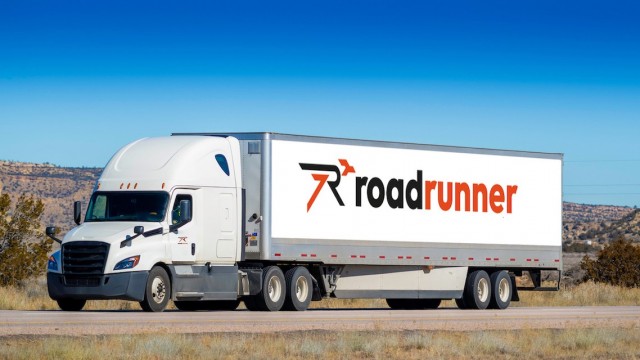
LTL provider Roadrunner ups service game again
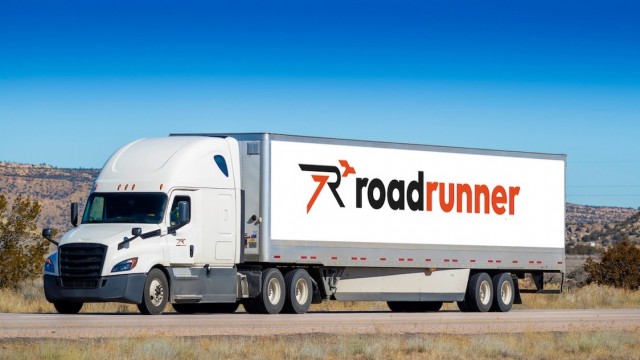
Roadrunner adds more direct lanes, improves service times
Roadrunner Transportation Systems Announces Third Quarter 2019 Release Date and Conference Call
Roadrunner Transportation Systems Announces Second Quarter 2019 Release Date and Conference Call
CORRECTING and REPLACING Roadrunner Transportation Systems Announces First Quarter 2019 Release Date and Conference Call
Roadrunner Transportation Systems Announces Fiscal Year 2018 Release Date and Conference Call
Roadrunner to Commence Fully Backstopped $450 Million Rights Offering
Roadrunner Transportation Systems Announces Third Quarter 2018 Release Date and Conference Call
Roadrunner Transportation Systems Announces Second Quarter 2018 Release Date and Conference Call
Roadrunner Transportation Systems Announces First Quarter 2018 Release Date and Conference Call for Full Year 2017 and First Quarter 2018
Source: https://incomestatements.info
Category: Stock Reports
