See more : Aarti Drugs Limited (AARTIDRUGS.BO) Income Statement Analysis – Financial Results
Complete financial analysis of Société Générale Société anonyme (SCGLF) income statement, including revenue, profit margins, EPS and key performance metrics. Get detailed insights into the financial performance of Société Générale Société anonyme, a leading company in the Banks – Regional industry within the Financial Services sector.
- Leverage Shares 3x Alibaba ETC Securities (3BBE.L) Income Statement Analysis – Financial Results
- Hengan International Group Company Limited (1044.HK) Income Statement Analysis – Financial Results
- Nihon Shokuhin Kako Co., Ltd. (2892.T) Income Statement Analysis – Financial Results
- ATA Creativity Global (AACG) Income Statement Analysis – Financial Results
- Information Services Corporation (IRMTF) Income Statement Analysis – Financial Results
Société Générale Société anonyme (SCGLF)
About Société Générale Société anonyme
Société Générale Société anonyme provides banking and financial services to individuals, businesses, and institutional investors in Europe and internationally. It operates through three segments: Retail Banking in France, International Retail Banking and Financial Services, and Global Banking and Investor Solutions. It offers retail banking services, such as consumer credit, vehicle leasing and fleet management, financing of professional equipment, and long-term leasing activities under the Societe Generale, Credit du Nord, and Boursorama brand names; and insurance products, including home, vehicle, family, health, and mortgage insurance. The company also provides corporate and investment banking, securities, market and investor, financing and consulting, and asset management and private banking services. In addition, it offers security brokerage, equipment finance, cash management, payment services, factoring, and supply chain financing services. The company serves through a network of 1849 branches. Société Générale Société anonyme was founded in 1864 and is based in Paris, France.
| Metric | 2023 | 2022 | 2021 | 2020 | 2019 | 2018 | 2017 | 2016 | 2015 | 2014 | 2013 | 2012 | 2011 | 2010 | 2009 | 2008 | 2007 | 2006 | 2005 | 2004 |
|---|---|---|---|---|---|---|---|---|---|---|---|---|---|---|---|---|---|---|---|---|
| Revenue | 24.08B | 38.65B | 36.25B | 31.82B | 34.13B | 34.01B | 46.00B | 43.70B | 77.36B | 71.91B | 80.23B | 60.62B | 47.90B | 44.81B | 38.27B | 35.50B | 30.82B | 37.47B | 32.64B | 30.26B |
| Cost of Revenue | -20.27B | 0.00 | 0.00 | 0.00 | 0.00 | 0.00 | 0.00 | 0.00 | 0.00 | 0.00 | 0.00 | 0.00 | 0.00 | 0.00 | 0.00 | 0.00 | 0.00 | 0.00 | 0.00 | 0.00 |
| Gross Profit | 44.35B | 38.65B | 36.25B | 31.82B | 34.13B | 34.01B | 46.00B | 43.70B | 77.36B | 71.91B | 80.23B | 60.62B | 47.90B | 44.81B | 38.27B | 35.50B | 30.82B | 37.47B | 32.64B | 30.26B |
| Gross Profit Ratio | 184.16% | 100.00% | 100.00% | 100.00% | 100.00% | 100.00% | 100.00% | 100.00% | 100.00% | 100.00% | 100.00% | 100.00% | 100.00% | 100.00% | 100.00% | 100.00% | 100.00% | 100.00% | 100.00% | 100.00% |
| Research & Development | 0.00 | 0.00 | 0.00 | 0.00 | 0.00 | 0.00 | 0.00 | 0.00 | 0.00 | 0.00 | 0.00 | 0.00 | 0.00 | 0.00 | 0.00 | 0.00 | 0.00 | 0.00 | 0.00 | 0.00 |
| General & Administrative | 1.32B | 5.30B | 4.87B | 4.44B | 5.05B | 5.71B | 5.33B | 4.52B | 6.48B | 6.06B | 6.25B | 6.00B | 6.45B | 6.05B | 5.68B | 6.04B | 5.35B | 4.64B | 3.99B | 3.65B |
| Selling & Marketing | 0.00 | 0.00 | 0.00 | 0.00 | 0.00 | 0.00 | 0.00 | 0.00 | 0.00 | 0.00 | 0.00 | 0.00 | 0.00 | 0.00 | 0.00 | 0.00 | 0.00 | 0.00 | 0.00 | 0.00 |
| SG&A | 1.32B | 5.30B | 4.87B | 4.44B | 5.05B | 5.71B | 5.33B | 4.52B | 6.48B | 6.06B | 6.25B | 6.00B | 6.45B | 6.05B | 5.68B | 6.04B | 5.35B | 4.64B | 3.99B | 3.65B |
| Other Expenses | 0.00 | -7.27B | -6.37B | -6.69B | -5.63B | -8.00B | 278.00M | -212.00M | 197.00M | 109.00M | 575.00M | -507.00M | 0.00 | 11.00M | 684.00M | 333.00M | 40.00M | 25.00M | 125.00M | 0.00 |
| Operating Expenses | 2.38B | 28.52B | 27.65B | 26.23B | 26.95B | 26.61B | 39.01B | 34.97B | 68.89B | 64.74B | 74.37B | 54.34B | 39.38B | 34.97B | 33.30B | 29.74B | 29.15B | 29.24B | 26.08B | 25.06B |
| Cost & Expenses | 2.38B | 28.52B | 27.65B | 26.23B | 26.95B | 26.61B | 39.01B | 34.97B | 68.89B | 64.74B | 74.37B | 54.34B | 39.38B | 34.97B | 33.30B | 29.74B | 29.15B | 29.24B | 26.08B | 25.06B |
| Interest Income | 53.09B | 28.84B | 20.59B | 20.72B | 23.71B | 22.68B | 23.68B | 24.66B | 25.43B | 24.53B | 27.27B | 29.90B | 32.39B | 28.29B | 30.55B | 40.19B | 38.09B | 30.06B | 21.10B | 21.84B |
| Interest Expense | 42.78B | 17.55B | 9.87B | 10.25B | 12.53B | 11.66B | 13.26B | 15.19B | 16.13B | 14.53B | 17.18B | 18.59B | 20.18B | 16.32B | 18.91B | 32.24B | 35.59B | 26.94B | 16.66B | 15.70B |
| Depreciation & Amortization | 7.71B | 5.34B | 5.44B | 5.26B | 5.22B | 4.57B | 4.26B | 3.88B | 3.60B | 3.42B | 3.36B | 3.26B | 3.13B | 2.91B | 2.82B | 2.67B | 2.38B | 2.14B | 1.81B | 1.76B |
| EBITDA | 0.00 | 0.00 | 0.00 | 0.00 | 0.00 | 0.00 | 0.00 | 0.00 | 0.00 | 0.00 | 0.00 | 0.00 | 0.00 | 0.00 | 0.00 | 0.00 | 0.00 | 0.00 | 0.00 | 0.00 |
| EBITDA Ratio | 0.00% | 23.12% | 35.26% | 19.51% | 28.40% | 29.45% | 19.13% | 22.24% | 12.04% | 10.43% | 7.56% | 7.21% | 14.28% | 18.68% | 8.32% | 16.65% | 11.72% | 25.76% | 24.50% | 21.20% |
| Operating Income | 21.70B | 3.58B | 7.34B | 946.00M | 4.51B | 5.43B | 4.51B | 5.84B | 5.72B | 4.08B | 2.71B | 1.11B | 3.71B | 5.46B | 370.00M | 3.25B | 1.23B | 7.51B | 6.19B | 4.66B |
| Operating Income Ratio | 90.12% | 9.26% | 20.24% | 2.97% | 13.22% | 15.95% | 9.81% | 13.37% | 7.39% | 5.67% | 3.38% | 1.83% | 7.74% | 12.18% | 0.97% | 9.14% | 3.99% | 20.05% | 18.97% | 15.39% |
| Total Other Income/Expenses | -16.57B | -19.16B | -5.96B | -6.23B | -1.36B | -1.05B | -7.62B | -83.00M | 428.00M | -203.00M | 678.00M | 434.00M | 403.00M | 131.00M | 684.00M | 763.00M | 657.00M | 564.00M | 514.00M | 342.00M |
| Income Before Tax | 5.13B | 4.51B | 8.04B | 1.40B | 5.21B | 6.12B | 5.14B | 6.31B | 6.11B | 4.38B | 3.06B | 1.54B | 4.11B | 5.84B | 800.00M | 4.01B | 1.89B | 8.08B | 6.71B | 5.00B |
| Income Before Tax Ratio | 21.30% | 11.66% | 22.17% | 4.40% | 15.26% | 17.99% | 11.17% | 14.43% | 7.90% | 6.08% | 3.81% | 2.54% | 8.58% | 13.04% | 2.09% | 11.29% | 6.12% | 21.56% | 20.55% | 16.52% |
| Income Tax Expense | 1.68B | 1.56B | 1.70B | 1.20B | 1.26B | 1.56B | 1.71B | 1.97B | 1.71B | 1.38B | 533.00M | 334.00M | 1.32B | 1.54B | -308.00M | 1.24B | 282.00M | 2.29B | 1.79B | 1.38B |
| Net Income | 2.49B | 1.83B | 5.64B | -258.00M | 2.54B | 3.40B | 2.34B | 3.40B | 3.56B | 2.27B | 1.71B | 774.00M | 2.36B | 3.58B | 678.00M | 1.83B | 858.00M | 5.18B | 4.38B | 3.28B |
| Net Income Ratio | 10.35% | 4.72% | 15.56% | -0.81% | 7.43% | 10.00% | 5.09% | 7.78% | 4.60% | 3.15% | 2.13% | 1.28% | 4.93% | 7.99% | 1.77% | 5.14% | 2.78% | 13.82% | 13.41% | 10.84% |
| EPS | 1.51 | 2.22 | 5.97 | -0.30 | 3.06 | 4.24 | 2.92 | 4.26 | 4.49 | 2.90 | 2.23 | 1.03 | 3.20 | 4.96 | 1.09 | 3.20 | 1.74 | 11.02 | 9.56 | 7.13 |
| EPS Diluted | 2.17 | 2.22 | 5.97 | -0.30 | 3.06 | 4.24 | 2.92 | 4.26 | 4.49 | 2.90 | 2.23 | 1.03 | 3.18 | 4.94 | 1.08 | 3.19 | 1.72 | 10.86 | 9.48 | 7.07 |
| Weighted Avg Shares Out | 1.15B | 822.44M | 846.26M | 850.38M | 829.90M | 801.91M | 800.60M | 798.77M | 792.50M | 781.28M | 766.49M | 751.74M | 739.38M | 721.72M | 624.49M | 570.04M | 491.19M | 470.27M | 457.69M | 460.07M |
| Weighted Avg Shares Out (Dil) | 799.32M | 822.44M | 846.26M | 850.38M | 829.90M | 801.91M | 800.60M | 798.79M | 792.60M | 781.46M | 766.83M | 752.76M | 742.11M | 725.16M | 626.82M | 573.16M | 497.37M | 476.68M | 461.76M | 464.21M |

The euro won't rebound from its slide against the US dollar this year as long as Europe's gas crisis drags on, Societe Generale says
The Frustrating Wait Goes On For Societe Generale To Be Rewarded For Its Progress

Commodity prices from copper to wheat are collapsing and that could flip global inflation into deflation, says Societe Generale
Brazil's antitrust body fines Citibank, Société Générale for currency manipulation
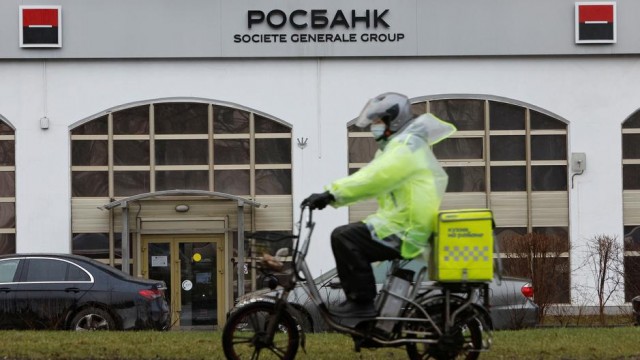
France's Societe Generale closes Rosbank sale
Rogue trader, euro zone crisis and war, Socgen's CEO ends 'bumpy' ride at top
Societe Generale: Buyback Could Compensate Up To 80% Of Rosbank Loss
France's Societe Generale sells Russian bank to oligarch Vladimir Potanin
French lender SocGen to exit Russia with Rosbank stake sale

Expectations on ECB liftoff brought forward by Goldman Sachs and Societe Generale
Source: https://incomestatements.info
Category: Stock Reports
