See more : Minerals Technologies Inc. (MTX) Income Statement Analysis – Financial Results
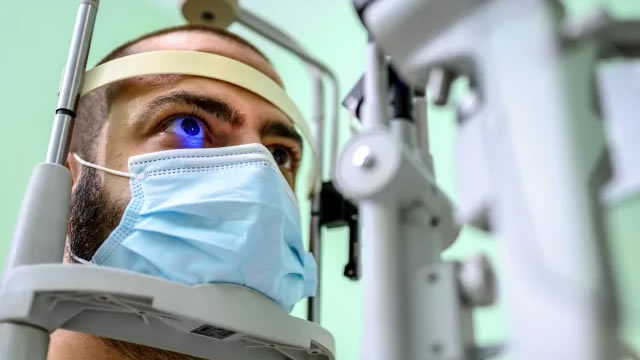
Complete financial analysis of Sight Sciences, Inc. (SGHT) income statement, including revenue, profit margins, EPS and key performance metrics. Get detailed insights into the financial performance of Sight Sciences, Inc., a leading company in the Medical – Devices industry within the Healthcare sector.
- GENPHARMASEC LIMITED (GENPHARMA.BO) Income Statement Analysis – Financial Results
- Airesis SA (0QQV.L) Income Statement Analysis – Financial Results
- Property Solutions Acquisition Corp. II (PSAGW) Income Statement Analysis – Financial Results
- Sern Kou Resources Berhad (7180.KL) Income Statement Analysis – Financial Results
- Thai Coconut Public Company Limited (COCOCO.BK) Income Statement Analysis – Financial Results
Sight Sciences, Inc. (SGHT)
About Sight Sciences, Inc.
Sight Sciences, Inc., an ophthalmic medical device company, engages in the development and commercialization of surgical and nonsurgical technologies for the treatment of eye diseases. The company's products include OMNI Surgical System, a therapeutic device used by ophthalmic surgeons to reduce intraocular pressure in adult glaucoma patients; and TearCare System, a wearable eyelid technology for the treatment of dry eye disease (DED) for ophthalmologists and optometrists. It offers its products through sales representatives and distributors to hospitals, medical centers, and eyecare professionals in the United States. The company was incorporated in 2010 and is headquartered in Menlo Park, California.
| Metric | 2023 | 2022 | 2021 | 2020 | 2019 | 2018 |
|---|---|---|---|---|---|---|
| Revenue | 81.06M | 71.33M | 48.96M | 27.64M | 23.35M | 7.53M |
| Cost of Revenue | 11.88M | 12.36M | 8.61M | 9.21M | 6.54M | 2.34M |
| Gross Profit | 69.18M | 58.97M | 40.35M | 18.43M | 16.80M | 5.19M |
| Gross Profit Ratio | 85.34% | 82.67% | 82.41% | 66.68% | 71.97% | 68.95% |
| Research & Development | 17.56M | 22.86M | 15.63M | 8.87M | 8.12M | 5.43M |
| General & Administrative | 106.79M | 117.47M | 74.09M | 40.95M | 30.92M | 13.06M |
| Selling & Marketing | 2.10M | 2.60M | 2.10M | 800.00K | 1.80M | 1.00M |
| SG&A | 108.89M | 120.07M | 76.19M | 41.75M | 32.72M | 14.06M |
| Other Expenses | 0.00 | 2.23M | -6.93M | -71.00K | -35.00K | 0.00 |
| Operating Expenses | 126.45M | 142.92M | 91.82M | 50.62M | 40.84M | 19.49M |
| Cost & Expenses | 138.33M | 155.29M | 100.43M | 59.83M | 47.39M | 21.83M |
| Interest Income | 0.00 | 4.47M | 4.37M | 30.00K | 174.00K | 1.00K |
| Interest Expense | 5.41M | 4.47M | 4.37M | 2.40M | 1.96M | 0.00 |
| Depreciation & Amortization | 614.00K | 1.25M | 1.20M | 1.12M | 432.00K | 63.00K |
| EBITDA | -49.42M | -80.48M | -57.21M | -31.68M | -23.47M | -14.23M |
| EBITDA Ratio | -60.96% | -114.58% | -119.30% | -114.60% | -101.10% | -189.02% |
| Operating Income | -57.27M | -83.95M | -51.48M | -32.19M | -24.04M | -14.30M |
| Operating Income Ratio | -70.66% | -117.70% | -105.15% | -116.45% | -102.96% | -189.87% |
| Total Other Income/Expenses | 1.84M | -2.24M | -11.29M | -2.44M | -1.82M | 1.00K |
| Income Before Tax | -55.44M | -86.20M | -62.77M | -34.63M | -25.86M | -14.30M |
| Income Before Tax Ratio | -68.39% | -120.84% | -128.22% | -125.30% | -110.76% | -189.85% |
| Income Tax Expense | 110.00K | 47.00K | 188.00K | 61.00K | 8.00K | -6.00K |
| Net Income | -55.55M | -86.24M | -62.96M | -34.69M | -25.87M | -14.29M |
| Net Income Ratio | -68.53% | -120.90% | -128.61% | -125.52% | -110.80% | -189.77% |
| EPS | -1.14 | -1.80 | -1.33 | -0.74 | -0.55 | -0.44 |
| EPS Diluted | -1.14 | -1.80 | -1.33 | -0.74 | -0.55 | -0.44 |
| Weighted Avg Shares Out | 48.63M | 47.85M | 47.50M | 46.77M | 46.77M | 32.20M |
| Weighted Avg Shares Out (Dil) | 48.63M | 47.85M | 47.50M | 46.77M | 46.77M | 32.20M |

Sight Sciences Proposes Terms For $150 Million IPO
Source: https://incomestatements.info
Category: Stock Reports
