See more : The Clorox Company (0I0J.L) Income Statement Analysis – Financial Results
Complete financial analysis of Soma Gold Corp. (SMAGF) income statement, including revenue, profit margins, EPS and key performance metrics. Get detailed insights into the financial performance of Soma Gold Corp., a leading company in the Gold industry within the Basic Materials sector.
- Shandong Donghong Pipe Industry Co., Ltd. (603856.SS) Income Statement Analysis – Financial Results
- CD Projekt S.A. (CDR.WA) Income Statement Analysis – Financial Results
- UBI Blockchain Internet, Ltd. (UBIA) Income Statement Analysis – Financial Results
- IBJ, Inc. (6071.T) Income Statement Analysis – Financial Results
- iStar Inc. (STAR) Income Statement Analysis – Financial Results
Soma Gold Corp. (SMAGF)
About Soma Gold Corp.
Soma Gold Corp., a natural resource company, engages in the acquisition, exploration, and development of mineral properties in South America. The company's principal operation is the El Bagre gold mining complex, which consists of an operating gold processing plant, the La Ye and Los Mangos operating underground gold mines, and the Cordero underground mine development project located in the Antioquia, Colombia. It also holds a 100% interest in the Zara exploration properties covering an area of approximately 29,000 hectares located in Antioquia, Colombia; and the El Limon gold mine located in Colombia. In addition, the company holds interest in the Nechí Gold project located in Antioquia, Colombia. The company was formerly known as Para Resources Inc. and changed its name to Soma Gold Corp. in May 2020. Soma Gold Corp. is headquartered in Vancouver, Canada.
| Metric | 2023 | 2022 | 2021 | 2020 | 2019 | 2018 | 2017 | 2016 | 2015 | 2014 | 2013 | 2012 | 2011 |
|---|---|---|---|---|---|---|---|---|---|---|---|---|---|
| Revenue | 81.16M | 52.96M | 39.97M | 23.05M | 0.00 | 0.00 | 0.00 | 0.00 | 0.00 | 0.00 | 0.00 | 0.00 | 0.00 |
| Cost of Revenue | 53.21M | 37.41M | 27.90M | 14.69M | 22.38K | 31.80K | 0.00 | 0.00 | 0.00 | 0.00 | 0.00 | 0.00 | 0.00 |
| Gross Profit | 27.95M | 15.54M | 12.06M | 8.36M | -22.38K | -31.80K | 0.00 | 0.00 | 0.00 | 0.00 | 0.00 | 0.00 | 0.00 |
| Gross Profit Ratio | 34.44% | 29.35% | 30.18% | 36.29% | 0.00% | 0.00% | 0.00% | 0.00% | 0.00% | 0.00% | 0.00% | 0.00% | 0.00% |
| Research & Development | 0.00 | 0.00 | 0.00 | 0.00 | 0.00 | 0.00 | 0.00 | 0.00 | 0.00 | 0.00 | 0.00 | 0.00 | 0.00 |
| General & Administrative | 2.82M | 6.08M | 5.38M | 5.99M | 3.21M | 6.39M | 5.14M | 2.13M | 472.52K | 310.51K | 441.41K | 1.41M | 102.02K |
| Selling & Marketing | 4.17M | -3.16M | 0.00 | 0.00 | 0.00 | 0.00 | 0.00 | 0.00 | 0.00 | 0.00 | 0.00 | 0.00 | 0.00 |
| SG&A | 6.99M | 2.91M | 5.38M | 5.99M | 3.21M | 6.39M | 5.14M | 2.13M | 472.52K | 310.51K | 441.41K | 1.41M | 102.02K |
| Other Expenses | 0.00 | 209.26K | 301.88K | -1.03M | 53.15K | -36.50K | 0.00 | 0.00 | 0.00 | 0.00 | 0.00 | 0.00 | 0.00 |
| Operating Expenses | 27.95M | 2.91M | 5.38M | 5.99M | 3.35M | 6.46M | 5.19M | 2.14M | 472.52K | 310.51K | 477.44K | 1.46M | 102.02K |
| Cost & Expenses | 60.10M | 40.33M | 33.28M | 20.68M | 3.38M | 6.50M | 5.19M | 2.14M | 472.52K | 310.51K | 477.44K | 1.46M | 102.02K |
| Interest Income | 0.00 | 0.00 | 0.00 | 348.13K | 160.55K | 0.00 | 0.00 | 0.00 | 0.00 | 0.00 | 0.00 | 0.00 | 0.00 |
| Interest Expense | 6.48M | 4.95M | 5.29M | 3.06M | 2.09M | 2.84M | 1.65M | 790.87K | 124.99K | 73.47K | 21.54K | 0.00 | 0.00 |
| Depreciation & Amortization | 10.65M | 3.85M | 3.10M | 1.17M | 22.38K | 31.80K | 58.93K | 6.75K | 0.00 | 0.00 | 19.32K | 0.00 | 0.00 |
| EBITDA | 31.11M | 12.56M | 10.16M | 2.85M | -4.67M | -5.11M | -5.58M | -1.43M | -472.52K | -310.51K | -477.44K | -1.46M | -102.02K |
| EBITDA Ratio | 38.33% | 31.12% | 25.24% | 12.38% | 0.00% | 0.00% | 0.00% | 0.00% | 0.00% | 0.00% | 0.00% | 0.00% | 0.00% |
| Operating Income | 20.85M | 12.63M | 6.99M | 1.69M | -3.29M | -6.53M | -5.19M | -2.14M | -472.52K | -310.51K | -496.76K | -1.46M | -102.02K |
| Operating Income Ratio | 25.69% | 23.85% | 17.49% | 7.32% | 0.00% | 0.00% | 0.00% | 0.00% | 0.00% | 0.00% | 0.00% | 0.00% | 0.00% |
| Total Other Income/Expenses | -6.87M | -9.14M | -4.22M | 5.83M | -32.97M | -4.43M | -1.90M | 14.53K | -421.45K | -73.47K | -2.89M | 0.00 | -84.24K |
| Income Before Tax | 13.97M | 3.76M | 2.77M | 8.72M | -36.27M | -11.71M | -7.09M | -2.12M | -893.97K | -383.98K | -3.39M | -1.46M | 0.00 |
| Income Before Tax Ratio | 17.22% | 7.10% | 6.92% | 37.82% | 0.00% | 0.00% | 0.00% | 0.00% | 0.00% | 0.00% | 0.00% | 0.00% | 0.00% |
| Income Tax Expense | 11.18M | 3.50M | 3.98M | 1.72M | -3.79M | -1.02M | 1.29M | 3.77K | 0.00 | 0.00 | 2.22K | 0.00 | 102.02K |
| Net Income | 2.80M | 257.54K | -1.22M | 6.72M | -37.66M | -10.14M | -6.74M | -1.91M | -893.97K | -383.98K | -3.39M | -1.46M | -102.02K |
| Net Income Ratio | 3.45% | 0.49% | -3.05% | 29.14% | 0.00% | 0.00% | 0.00% | 0.00% | 0.00% | 0.00% | 0.00% | 0.00% | 0.00% |
| EPS | 0.03 | 0.00 | -0.02 | 0.15 | -1.79 | -0.65 | -0.57 | -0.33 | -0.35 | -0.62 | -6.04 | -5.22 | -1.21 |
| EPS Diluted | 0.03 | 0.00 | -0.02 | 0.14 | -1.79 | -0.65 | -0.57 | -0.33 | -0.35 | -0.62 | -6.04 | -5.22 | -1.21 |
| Weighted Avg Shares Out | 93.23M | 85.06M | 63.86M | 45.33M | 21.05M | 15.50M | 11.76M | 5.82M | 2.56M | 619.80K | 561.16K | 280.81K | 84.60K |
| Weighted Avg Shares Out (Dil) | 93.90M | 87.22M | 63.86M | 49.27M | 21.05M | 15.50M | 11.76M | 5.82M | 2.56M | 619.80K | 561.16K | 280.81K | 84.60K |

Soma Gold announces 1Q gold production of 6,796 gold equivalent ounces at El Bagre mine in Colombia
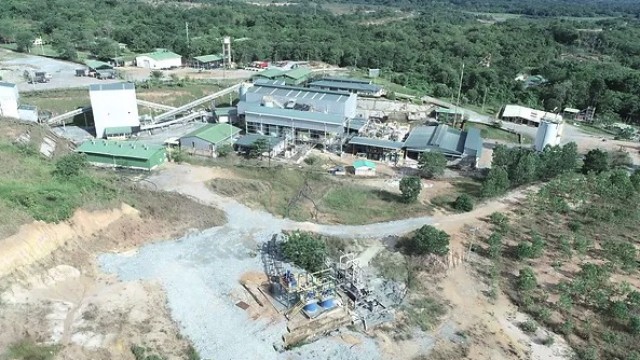
Soma Gold signs collaboration agreement with Environmental Authority of the Province of Antioquia, Columbia

Soma Gold temporarily suspends mining operations at El Bagre due to 'civil unrest'
Soma Gold starts the year with record gold production at El Bagre gold mine in Colombia

Soma Gold brings on Mark Bren as new vice president of operations
Soma Gold says gold production at El Bagre in Colombia rose 30% in 2022
Soma Gold adds more ounces as it progresses with El Bagre and Nechí Projects, develops Cordero Mine in Colombia

Soma Gold reports income from mine operations of C$4.1 million in third quarter

Soma Gold sees second highest quarterly gold sales in 3Q
Soma Gold appoints Christopher Buchanan as vice-president, exploration
Source: https://incomestatements.info
Category: Stock Reports
