See more : MongoDB, Inc. (0KKZ.L) Income Statement Analysis – Financial Results
Complete financial analysis of Strategic Minerals Plc (SMCDF) income statement, including revenue, profit margins, EPS and key performance metrics. Get detailed insights into the financial performance of Strategic Minerals Plc, a leading company in the Industrial Materials industry within the Basic Materials sector.
- Defence Tech Holding S.p.A. (DTH.MI) Income Statement Analysis – Financial Results
- Clear Peak Energy, Inc. (CLPE) Income Statement Analysis – Financial Results
- Energy International Investments Holdings Limited (0353.HK) Income Statement Analysis – Financial Results
- Fukushima Galilei Co.Ltd. (6420.T) Income Statement Analysis – Financial Results
- Ecclesiastical Insurance Office plc (ELLA.L) Income Statement Analysis – Financial Results
Strategic Minerals Plc (SMCDF)
About Strategic Minerals Plc
Strategic Minerals Plc engages in the exploration, development, and operation of mining projects. The company operates the Cobre mine in New Mexico, which sells magnetite for use in the cement, fertilizer, dense media/medium, paint pigment, water jet cutting, ballast, magnet, toner, coal cleaning, and landscaping markets. It also holds interest in the Leigh Creek Copper Mine located in the North Flinders Ranges of South Australia; and the Redmoor tin/tungsten project in Cornwall, the United Kingdom. The company was incorporated in 2010 and is based in London, the United Kingdom.
| Metric | 2023 | 2022 | 2021 | 2020 | 2019 | 2018 | 2017 | 2016 | 2015 | 2014 | 2013 | 2012 | 2011 | 2010 |
|---|---|---|---|---|---|---|---|---|---|---|---|---|---|---|
| Revenue | 1.58M | 2.45M | 2.61M | 3.03M | 3.39M | 3.36M | 5.64M | 1.55M | 1.25M | 6.09M | 37.24M | 6.07M | 0.00 | 0.00 |
| Cost of Revenue | 262.00K | 494.00K | 524.00K | 562.00K | 511.00K | 650.00K | 914.00K | 337.00K | 246.00K | 6.72M | 35.24M | 4.61M | 0.00 | 0.00 |
| Gross Profit | 1.32M | 1.95M | 2.09M | 2.46M | 2.88M | 2.71M | 4.73M | 1.22M | 1.01M | -629.00K | 2.01M | 1.46M | 0.00 | 0.00 |
| Gross Profit Ratio | 83.39% | 79.80% | 79.93% | 81.42% | 84.92% | 80.63% | 83.80% | 78.29% | 80.35% | -10.33% | 5.38% | 24.05% | 0.00% | 0.00% |
| Research & Development | 0.00 | 0.00 | 0.00 | 0.00 | 0.00 | 0.00 | 0.00 | 0.00 | 0.00 | 0.00 | 0.00 | 0.00 | 0.00 | 0.00 |
| General & Administrative | 270.00K | 460.00K | 451.00K | 733.00K | 807.00K | 756.00K | 568.00K | 637.00K | 728.00K | 582.00K | 1.51M | 3.46M | 55.89K | 0.00 |
| Selling & Marketing | 0.00 | 0.00 | 0.00 | 0.00 | 5.00K | 95.00K | 121.00K | 79.00K | 57.00K | 76.00K | 252.00K | 226.24K | 214.26K | 6.22K |
| SG&A | 270.00K | 460.00K | 451.00K | 733.00K | 812.00K | 851.00K | 689.00K | 716.00K | 785.00K | 658.00K | 1.76M | 3.69M | 55.89K | 6.22K |
| Other Expenses | 10.11M | 1.28M | 0.00 | 0.00 | 0.00 | 0.00 | 0.00 | 0.00 | 0.00 | 0.00 | 0.00 | 0.00 | 0.00 | 0.00 |
| Operating Expenses | 10.38M | 1.55M | 1.81M | 2.05M | 2.56M | 2.66M | 2.40M | 1.51M | 500.00K | 3.23M | 13.56M | 8.27M | 3.74M | 281.38K |
| Cost & Expenses | 10.65M | 2.06M | 2.33M | 2.61M | 3.07M | 3.31M | 3.31M | 1.84M | 746.00K | 9.95M | 48.80M | 12.88M | 3.74M | 281.38K |
| Interest Income | 0.00 | 0.00 | 22.00K | 74.00K | 52.00K | 0.00 | 0.00 | 0.00 | 0.00 | 0.00 | 0.00 | 0.00 | 37.26K | 0.00 |
| Interest Expense | 38.00K | 18.00K | 15.00K | 9.00K | 52.00K | 0.00 | 0.00 | 0.00 | 4.00K | 14.00K | 673.00K | 1.15M | 51.24K | 0.00 |
| Depreciation & Amortization | 293.00K | 294.00K | 210.00K | 167.00K | 17.00K | 64.00K | 74.00K | 48.00K | 10.00K | 1.55M | 9.62M | 1.45M | 3.11K | 1.55K |
| EBITDA | -8.75M | 684.00K | 482.00K | 626.00K | 336.00K | 2.00M | 2.41M | -242.00K | -866.00K | -4.50M | -18.68M | -5.33M | -3.64M | -279.83K |
| EBITDA Ratio | -554.91% | 27.96% | 18.46% | 15.57% | 9.83% | 11.03% | 42.64% | -17.78% | 40.34% | -34.98% | -5.35% | -90.12% | 0.00% | 0.00% |
| Operating Income | -9.07M | 390.00K | 279.00K | 524.00K | -755.00K | 1.96M | 2.30M | 351.00K | -876.00K | -6.04M | -28.30M | -6.91M | -5.29M | -281.38K |
| Operating Income Ratio | -575.02% | 15.94% | 10.69% | 17.32% | -22.28% | 58.42% | 40.71% | 22.62% | -69.97% | -99.23% | -75.98% | -113.99% | 0.00% | 0.00% |
| Total Other Income/Expenses | -14.00K | -18.00K | -22.00K | -74.00K | -90.00K | -27.00K | -98.00K | 641.00K | -237.00K | 169.00K | -17.42M | -1.13M | 288.78K | 0.00 |
| Income Before Tax | -9.08M | 372.00K | 257.00K | 450.00K | -845.00K | 1.93M | 2.23M | 351.00K | -880.00K | -6.06M | -28.97M | -8.07M | -5.00M | -281.38K |
| Income Before Tax Ratio | -575.90% | 15.21% | 9.84% | 14.88% | -24.94% | 57.62% | 39.60% | 22.62% | -70.29% | -99.46% | -77.79% | -133.00% | 0.00% | 0.00% |
| Income Tax Expense | 107.00K | 288.00K | 101.00K | 236.00K | 385.00K | 460.00K | 648.00K | -675.00K | 1.37M | -324.00K | -5.09M | -1.03M | 1.64M | 0.00 |
| Net Income | -9.19M | 84.00K | 156.00K | 214.00K | -1.23M | 1.47M | 1.59M | 351.00K | -880.00K | -5.73M | -23.88M | -7.04M | -5.00M | -281.38K |
| Net Income Ratio | -582.69% | 3.43% | 5.97% | 7.07% | -36.30% | 43.90% | 28.11% | 22.62% | -70.29% | -94.14% | -64.12% | -116.09% | 0.00% | 0.00% |
| EPS | -0.01 | 0.00 | 0.10 | 0.00 | 0.00 | 0.00 | 0.00 | 0.00 | 0.00 | -0.01 | -0.04 | -0.02 | -0.02 | 0.00 |
| EPS Diluted | -0.01 | 0.00 | 0.10 | 0.00 | 0.00 | 0.00 | 0.00 | 0.00 | 0.00 | -0.01 | -0.04 | -0.02 | -0.02 | 0.00 |
| Weighted Avg Shares Out | 1.59B | 1.59B | 1.59B | 1.57B | 1.43B | 1.37B | 1.04B | 1.01B | 810.00M | 629.90M | 542.43M | 434.53M | 278.72M | 219.16M |
| Weighted Avg Shares Out (Dil) | 1.59B | 1.59B | 1.59B | 1.57B | 1.43B | 1.38B | 1.08B | 1.07B | 810.00M | 629.90M | 542.43M | 434.53M | 278.72M | 219.16M |
Strategic Minerals jumps 50% after 'spectacular quarter'
Strategic Minerals ups guidance as Cobre exceeds expectations
Strategic Minerals director hails "substantial amount of excellent work" at Redmoor Project
Strategic Minerals revenues recover as new contracts kick in

Strategic Minerals revenues recover as new contracts kick in

Strategic Minerals opens higher on the Duchy of Cornwall deal

Strategic Minerals says Duchy of Cornwall deal materially increases Tamar Valley footprint
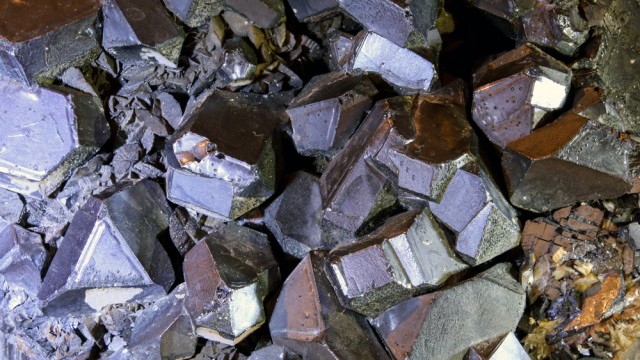
Strategic Minerals sees Cobre sales at six-year high
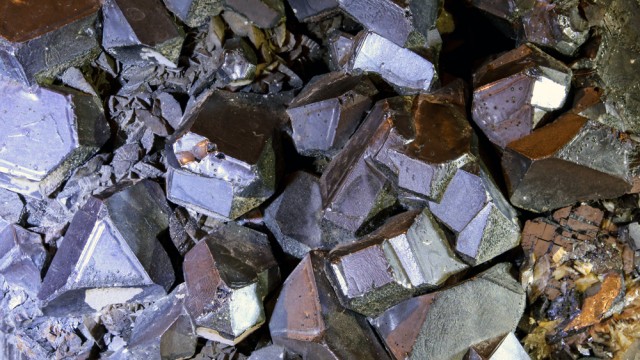
Strategic Minerals lands second customer at Cobre

Strategic Minerals soars after renewing with major customer
Source: https://incomestatements.info
Category: Stock Reports
