See more : Travis Perkins plc (TPK.L) Income Statement Analysis – Financial Results
Complete financial analysis of Samsung Electronics Co., Ltd. (SSNLF) income statement, including revenue, profit margins, EPS and key performance metrics. Get detailed insights into the financial performance of Samsung Electronics Co., Ltd., a leading company in the Consumer Electronics industry within the Technology sector.
- Dodla Dairy Limited (DODLA.BO) Income Statement Analysis – Financial Results
- Spectris plc (SXS.L) Income Statement Analysis – Financial Results
- Zhong Yuan Bio-Technology Holdings Limited (ZHYBF) Income Statement Analysis – Financial Results
- Beijing Gas Blue Sky Holdings Limited (BJGBF) Income Statement Analysis – Financial Results
- Huasi Holding Company Limited (002494.SZ) Income Statement Analysis – Financial Results
Samsung Electronics Co., Ltd. (SSNLF)
About Samsung Electronics Co., Ltd.
Samsung Electronics Co., Ltd. engages in the consumer electronics, information technology and mobile communications, and device solutions businesses worldwide. It provides home appliances comprising of refrigerators, air dresser, washing machines, dryers, cooking appliances, dishwashers, vacuum cleaners, air conditioners, and air purifiers. The company also offers TVs, sound devices, smartphones, tablets, monitors, smart and LED signages, watches, and other accessories, as well as provides memory storage solutions. In addition, it provides medical equipment; software design, development, and supply; toll processing of semiconductors and display panels; general logistics agency, financing, marketing, consulting, and technology and cloud services; venture capital investment; enterprise automation solutions and connected services; installation and optimization services for network devices; and digital advertising platforms. The company serves retail, hospitality, finance, transportation, education, government, manufacturing, public safety, and healthcare industries. Samsung Electronics Co., Ltd. was founded in 1938 and is based in Suwon-si, South Korea.
| Metric | 2023 | 2022 | 2021 | 2020 | 2019 | 2018 | 2017 | 2016 | 2015 | 2014 | 2013 | 2012 | 2011 | 2010 | 2009 | 2008 | 2007 | 2006 | 2005 |
|---|---|---|---|---|---|---|---|---|---|---|---|---|---|---|---|---|---|---|---|
| Revenue | 258,935.49B | 302,231.36B | 279,604.80B | 236,806.99B | 230,400.88B | 243,771.42B | 239,575.38B | 201,866.75B | 200,653.48B | 206,205.99B | 228,692.67B | 201,103.61B | 165,001.77B | 154,630.33B | 136,323.67B | 121,294.32B | 98,507.82B | 85,834.60B | 80,629.51B |
| Cost of Revenue | 180,388.58B | 190,041.77B | 166,411.34B | 144,488.30B | 147,239.55B | 132,394.41B | 129,290.66B | 120,277.72B | 123,482.12B | 128,278.80B | 137,696.31B | 126,651.93B | 112,145.12B | 102,666.82B | 94,594.86B | 89,762.36B | 70,880.91B | 60,055.92B | 55,251.65B |
| Gross Profit | 78,546.91B | 112,189.59B | 113,193.46B | 92,318.69B | 83,161.33B | 111,377.00B | 110,284.72B | 81,589.03B | 77,171.36B | 77,927.19B | 90,996.36B | 74,451.68B | 52,856.65B | 51,963.50B | 41,728.81B | 31,531.96B | 27,626.90B | 25,778.68B | 25,377.86B |
| Gross Profit Ratio | 30.33% | 37.12% | 40.48% | 38.98% | 36.09% | 45.69% | 46.03% | 40.42% | 38.46% | 37.79% | 39.79% | 37.02% | 32.03% | 33.60% | 30.61% | 26.00% | 28.05% | 30.03% | 31.47% |
| Research & Development | 28,339.72B | 24,919.20B | 22,401.73B | 21,111.49B | 19,907.24B | 18,354.08B | 16,355.61B | 14,111.38B | 13,705.70B | 14,385.51B | 14,319.40B | 11,532.80B | 9,979.84B | 9,099.35B | 7,386.71B | 7,057.91B | 6,073.96B | 5,714.76B | 5,499.95B |
| General & Administrative | 6,126.00B | 5,993.25B | 4,840.95B | 4,688.27B | 5,172.40B | 4,142.27B | 5,179.88B | 4,656.43B | 4,566.50B | 4,963.01B | 4,935.60B | 3,261.28B | 0.00 | 0.00 | 0.00 | 0.00 | 0.00 | 0.00 | 0.00 |
| Selling & Marketing | 26,552.16B | 27,567.71B | 24,687.07B | 26,084.79B | 27,022.18B | 26,237.17B | 32,150.28B | 31,258.90B | 30,243.28B | 31,931.24B | 33,142.00B | 28,207.88B | 11,421.04B | 7,901.48B | 9,930.84B | 0.00 | 0.00 | 0.00 | 0.00 |
| SG&A | 32,678.16B | 33,560.96B | 29,528.02B | 26,084.79B | 27,022.18B | 26,237.17B | 32,150.28B | 31,258.90B | 30,243.28B | 31,931.24B | 33,142.00B | 28,207.88B | 11,421.04B | 7,901.48B | 9,930.84B | 0.00 | 0.00 | 0.00 | 0.00 |
| Other Expenses | 10,962.05B | 10,332.81B | 9,629.86B | 9,128.53B | 8,463.41B | -119.53B | 1,427.24B | -840.34B | -490.41B | 671.45B | -228.04B | 453.88B | 92.15B | 96.56B | 92.85B | 17,098.60B | 12,609.52B | 11,118.19B | 12,395.54B |
| Operating Expenses | 71,979.94B | 68,812.96B | 61,559.60B | 56,324.82B | 55,392.82B | 52,490.34B | 56,639.68B | 52,348.36B | 50,757.92B | 52,902.12B | 54,211.34B | 45,402.34B | 35,229.51B | 34,123.89B | 30,203.73B | 24,156.51B | 18,683.48B | 16,832.95B | 17,895.48B |
| Cost & Expenses | 252,368.52B | 258,854.73B | 227,970.94B | 200,813.11B | 202,632.37B | 184,884.75B | 185,930.34B | 172,626.07B | 174,240.04B | 181,180.92B | 191,907.65B | 172,054.28B | 147,374.63B | 136,790.72B | 124,798.59B | 113,918.86B | 89,564.40B | 76,888.88B | 73,147.14B |
| Interest Income | 4,358.02B | 2,720.48B | 1,278.28B | 1,974.46B | 2,660.02B | 2,297.14B | 1,614.22B | 1,504.32B | 1,761.16B | 1,833.36B | 1,351.61B | 845.43B | 702.20B | 556.62B | 360.96B | 639.44B | 83.60B | 384.17B | 320.71B |
| Interest Expense | 930.25B | 763.02B | 431.54B | 583.01B | 686.36B | 674.62B | 655.40B | 587.83B | 776.51B | 592.94B | 509.66B | 599.01B | 644.13B | 581.09B | 535.29B | 670.27B | 590.52B | 294.45B | 218.23B |
| Depreciation & Amortization | 38,666.56B | 39,107.66B | 34,247.36B | 30,335.62B | 29,597.64B | 26,482.04B | 22,117.39B | 20,712.97B | 20,930.86B | 18,053.42B | 16,445.41B | 15,622.02B | 13,592.06B | 11,393.90B | 11,137.74B | 10,095.19B | 8,497.53B | 6,872.79B | 6,020.37B |
| EBITDA | 50,603.08B | 85,220.51B | 87,301.11B | 66,757.22B | 60,303.22B | 87,776.77B | 78,767.32B | 52,014.45B | 47,668.36B | 46,521.40B | 55,319.35B | 46,136.04B | 31,395.21B | 31,303.64B | 23,864.62B | 17,343.24B | 18,424.54B | 16,994.89B | 14,363.92B |
| EBITDA Ratio | 19.54% | 28.59% | 31.50% | 28.29% | 26.26% | 36.00% | 33.03% | 25.11% | 24.62% | 22.85% | 23.89% | 23.33% | 19.50% | 20.63% | 17.95% | 14.71% | 18.97% | 19.76% | 17.81% |
| Operating Income | 6,566.98B | 43,376.63B | 51,633.86B | 35,993.88B | 27,768.51B | 58,886.67B | 53,645.04B | 29,240.67B | 26,413.44B | 25,025.07B | 36,785.01B | 29,049.34B | 16,249.72B | 17,296.54B | 10,925.26B | 6,031.86B | 8,973.29B | 9,129.02B | 7,575.50B |
| Operating Income Ratio | 2.54% | 14.35% | 18.47% | 15.20% | 12.05% | 24.16% | 22.39% | 14.49% | 13.16% | 12.14% | 16.08% | 14.44% | 9.85% | 11.19% | 8.01% | 4.97% | 9.11% | 10.64% | 9.40% |
| Total Other Income/Expenses | 3,551.74B | 3,063.84B | 988.36B | -155.29B | 2,250.72B | 1,733.44B | 2,349.49B | 1,472.98B | -452.45B | 2,849.96B | 1,579.27B | 865.68B | 909.30B | 2,032.12B | 1,266.34B | 545.91B | 659.59B | 698.62B | 549.82B |
| Income Before Tax | 10,118.72B | 46,440.47B | 53,351.83B | 36,345.12B | 30,432.19B | 61,159.96B | 56,195.97B | 30,713.65B | 25,961.00B | 27,875.03B | 38,364.28B | 29,915.02B | 17,159.01B | 19,328.66B | 12,191.60B | 6,577.77B | 9,632.87B | 9,827.65B | 8,125.31B |
| Income Before Tax Ratio | 3.91% | 15.37% | 19.08% | 15.35% | 13.21% | 25.09% | 23.46% | 15.21% | 12.94% | 13.52% | 16.78% | 14.88% | 10.40% | 12.50% | 8.94% | 5.42% | 9.78% | 11.45% | 10.08% |
| Income Tax Expense | -4,480.84B | -9,213.60B | 13,444.38B | 9,937.29B | 8,693.32B | 16,815.10B | 14,009.22B | 7,987.56B | 6,900.85B | 4,480.68B | 7,889.52B | 6,069.73B | 3,424.95B | 3,182.13B | 2,431.05B | 687.56B | 1,709.89B | 1,633.99B | 1,218.25B |
| Net Income | 14,473.40B | 54,730.02B | 39,243.79B | 26,090.85B | 21,505.05B | 43,890.88B | 41,344.57B | 22,415.66B | 18,694.63B | 23,082.50B | 29,821.22B | 23,185.38B | 13,734.07B | 15,799.04B | 9,571.60B | 5,525.90B | 7,420.58B | 7,926.09B | 7,640.09B |
| Net Income Ratio | 5.59% | 18.11% | 14.04% | 11.02% | 9.33% | 18.00% | 17.26% | 11.10% | 9.32% | 11.19% | 13.04% | 11.53% | 8.32% | 10.22% | 7.02% | 4.56% | 7.53% | 9.23% | 9.48% |
| EPS | 2.13K | 8.06K | 5.78K | 3.84K | 3.17K | 6.46K | 6.00K | 3.16K | 2.53K | 3.06K | 3.96K | 3.08K | 1.78K | 2.12K | 1.30K | 753.68 | 990.04 | 1.06K | 999.38 |
| EPS Diluted | 2.13K | 8.06K | 5.78K | 3.84K | 3.17K | 6.46K | 6.00K | 3.16K | 2.53K | 3.06K | 3.96K | 3.08K | 1.78K | 2.11K | 1.29K | 746.80 | 978.48 | 1.04K | 982.56 |
| Weighted Avg Shares Out | 6.79B | 6.79B | 6.79B | 6.79B | 6.79B | 6.79B | 6.89B | 7.10B | 7.40B | 7.54B | 7.54B | 7.53B | 6.51B | 6.46B | 6.39B | 6.34B | 6.33B | 6.48B | 6.60B |
| Weighted Avg Shares Out (Dil) | 6.79B | 6.79B | 6.79B | 6.79B | 6.79B | 6.79B | 6.89B | 7.10B | 7.40B | 7.54B | 7.54B | 7.53B | 6.51B | 6.48B | 6.42B | 6.40B | 6.40B | 6.57B | 6.72B |

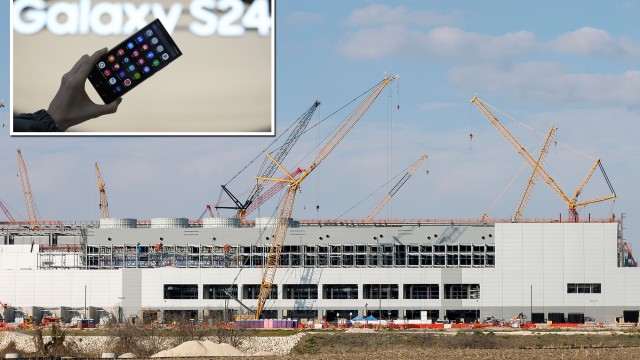
Samsung to get $6-7 billion in chip subsidy next week for Texas expansion, sources say

Samsung Elec shares being offered in $330 mln block sale, term sheet shows

The Apple Antitrust Fallout: 3 Stocks Poised to Capitalize on the Chaos

Unforgettable Gains: 3 Memory Stocks to Own as the Market Heats Up

Samsung plans $44B in Texas spending for vital computer chip as profits soar: report
Samsung to double semiconductor investment in Texas to $44 billion, says report
Samsung to double semiconductor investment in Texas to $44 billion, says report

AMD, Samsung, Check Point, Microsoft, and Other Tech Stocks in Focus Today

Nvidia Stock Gains. What Samsung's Profit Boost Means for the AI Chip Maker.

Samsung predicts 10-fold increase in profits as AI boom sees chip prices recover
Source: https://incomestatements.info
Category: Stock Reports
