See more : Heska Corporation (HSKA) Income Statement Analysis – Financial Results
Complete financial analysis of SSP Group plc (SSPPF) income statement, including revenue, profit margins, EPS and key performance metrics. Get detailed insights into the financial performance of SSP Group plc, a leading company in the Restaurants industry within the Consumer Cyclical sector.
- Scinex Corporation (2376.T) Income Statement Analysis – Financial Results
- ABC Taiwan Electronics Corp. (3236.TWO) Income Statement Analysis – Financial Results
- Adeia Inc. (0M2A.L) Income Statement Analysis – Financial Results
- Financial Strategies Acquisition Corp. (FXCOW) Income Statement Analysis – Financial Results
- Unibios Holdings S.A. (BIOSK.AT) Income Statement Analysis – Financial Results
SSP Group plc (SSPPF)
About SSP Group plc
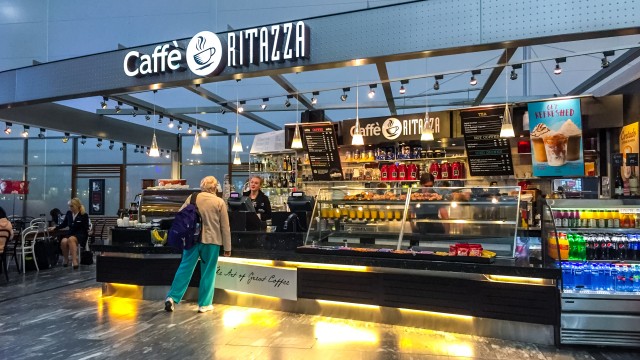
SSP Group plc operates food and beverage outlets. The company operates outlets at airports, railway stations, motorway service areas, hospitals, and shopping centers. It operates approximately 550 brands in 36 countries in the United Kingdom, Europe, North America, and internationally. SSP Group plc was incorporated in 2006 and is headquartered in London, the United Kingdom.
| Metric | 2024 | 2023 | 2022 | 2021 | 2020 | 2019 | 2018 | 2017 | 2016 | 2015 | 2014 | 2013 | 2012 | 2011 |
|---|---|---|---|---|---|---|---|---|---|---|---|---|---|---|
| Revenue | 3.43B | 3.01B | 2.19B | 834.20M | 1.43B | 2.79B | 2.56B | 2.38B | 1.99B | 1.83B | 1.83B | 1.83B | 1.74B | 1.72B |
| Cost of Revenue | 1.82B | 2.15B | 1.30B | 587.00M | 949.70M | 1.62B | 1.50B | 1.41B | 1.22B | 1.15B | 1.15B | 1.11B | 1.06B | 1.06B |
| Gross Profit | 1.62B | 858.10M | 888.50M | 247.20M | 483.40M | 1.18B | 1.07B | 964.90M | 772.20M | 686.90M | 673.20M | 720.50M | 677.60M | 662.40M |
| Gross Profit Ratio | 47.12% | 28.51% | 40.66% | 29.63% | 33.73% | 42.17% | 41.53% | 40.56% | 38.80% | 37.48% | 36.85% | 39.43% | 39.00% | 38.49% |
| Research & Development | 0.00 | 0.00 | 0.00 | 0.00 | 0.00 | 0.00 | 0.00 | 0.00 | 0.00 | 0.00 | 0.00 | 0.00 | 0.00 | 0.00 |
| General & Administrative | 0.00 | 0.00 | 2.30M | 800.00K | 0.00 | 0.00 | 0.00 | 0.00 | 0.00 | 0.00 | 0.00 | 0.00 | 0.00 | 0.00 |
| Selling & Marketing | 0.00 | 0.00 | 0.00 | 0.00 | 0.00 | 0.00 | 0.00 | 0.00 | 0.00 | 0.00 | 0.00 | 0.00 | 0.00 | 0.00 |
| SG&A | 0.00 | 347.50M | 2.30M | 800.00K | 480.00M | 852.20M | 772.20M | 706.50M | 572.00M | 205.00M | 207.20M | 204.80M | 0.00 | 0.00 |
| Other Expenses | 1.41B | 343.80M | 23.00M | 92.00M | 91.90M | 0.00 | 0.00 | 0.00 | 0.00 | 0.00 | 0.00 | 0.00 | 0.00 | 0.00 |
| Operating Expenses | 1.41B | 691.30M | 873.40M | 584.30M | 807.20M | 959.40M | 871.80M | 803.90M | 652.70M | 594.70M | 590.00M | 647.10M | 616.10M | 610.80M |
| Cost & Expenses | 3.23B | 2.84B | 2.17B | 1.17B | 1.76B | 2.58B | 2.37B | 2.22B | 1.87B | 1.74B | 1.74B | 1.75B | 1.68B | 1.67B |
| Interest Income | 15.30M | 16.80M | 17.60M | 17.10M | 2.50M | 2.30M | 1.90M | 900.00K | 400.00K | 700.00K | 800.00K | 1.60M | 1.40M | 1.10M |
| Interest Expense | 115.50M | 103.80M | 83.70M | 70.60M | 53.20M | 18.80M | 10.80M | 12.00M | 11.50M | 15.70M | 47.10M | 36.20M | 33.90M | 35.20M |
| Depreciation & Amortization | 373.40M | 310.80M | 281.70M | 349.10M | 427.30M | 107.50M | 100.00M | 97.40M | 81.10M | 78.10M | 81.00M | 79.20M | 77.60M | 78.40M |
| EBITDA | 607.50M | 502.70M | 390.60M | 7.70M | 54.30M | 320.20M | 293.30M | 256.20M | 200.50M | 170.60M | 161.50M | 144.60M | 125.90M | 130.50M |
| EBITDA Ratio | 17.69% | 16.70% | 14.58% | 11.02% | 11.05% | 11.70% | 11.61% | 10.85% | 10.07% | 9.36% | 8.84% | 7.91% | 8.31% | 7.58% |
| Operating Income | 205.90M | 166.80M | 91.50M | -309.20M | -363.90M | 219.20M | 193.30M | 161.00M | 119.50M | 92.20M | 40.00M | 67.20M | 52.10M | 51.60M |
| Operating Income Ratio | 6.00% | 5.54% | 4.19% | -37.07% | -25.39% | 7.84% | 7.54% | 6.77% | 6.00% | 5.03% | 2.19% | 3.68% | 3.00% | 3.00% |
| Total Other Income/Expenses | -87.30M | -78.70M | -66.30M | -102.00M | -61.90M | -22.00M | -10.40M | -16.20M | -13.90M | -15.40M | -53.50M | -51.00M | -37.70M | -58.30M |
| Income Before Tax | 118.60M | 88.10M | 25.20M | -411.20M | -425.80M | 197.20M | 182.90M | 144.80M | 105.60M | 76.80M | -13.50M | 16.20M | 14.40M | -6.70M |
| Income Before Tax Ratio | 3.45% | 2.93% | 1.15% | -49.29% | -29.71% | 7.06% | 7.13% | 6.09% | 5.31% | 4.19% | -0.74% | 0.89% | 0.83% | -0.39% |
| Income Tax Expense | 33.10M | 32.00M | 15.30M | -48.90M | -28.10M | 43.70M | 40.20M | 33.60M | 23.80M | 16.50M | 14.30M | 13.90M | 13.00M | 13.20M |
| Net Income | 27.40M | 8.10M | -10.20M | -357.30M | -375.00M | 126.90M | 117.20M | 92.80M | 72.00M | 53.40M | -31.90M | -1.20M | -600.00K | -22.40M |
| Net Income Ratio | 0.80% | 0.27% | -0.47% | -42.83% | -26.17% | 4.54% | 4.57% | 3.90% | 3.62% | 2.91% | -1.75% | -0.07% | -0.03% | -1.30% |
| EPS | 0.00 | 0.01 | -0.01 | -0.51 | -0.63 | 0.23 | 0.21 | 0.17 | 0.14 | 0.10 | -0.10 | 0.00 | 0.00 | -0.04 |
| EPS Diluted | 0.00 | 0.01 | -0.01 | -0.51 | -0.63 | 0.23 | 0.20 | 0.17 | 0.13 | 0.10 | -0.10 | 0.00 | 0.00 | -0.04 |
| Weighted Avg Shares Out | 0.00 | 810.00M | 796.05M | 696.98M | 594.93M | 546.49M | 569.61M | 546.76M | 529.08M | 528.93M | 333.47M | 528.89M | 528.89M | 528.89M |
| Weighted Avg Shares Out (Dil) | 0.00 | 805.97M | 796.05M | 696.98M | 594.93M | 553.68M | 577.48M | 555.38M | 533.06M | 530.20M | 333.60M | 528.89M | 528.89M | 528.89M |

Colossus SSP Launches 'Momentum' Program to Empower Underrepresented Publishers

Colossus SSP Launches Colossus Connections to Enhance Supply Path Efficiency for Advertisers

Colossus SSP Joins Industry Initiative to Bring Transparency to Digital Ad Auctions

Colossus SSP and Confiant Drive Unprecedented Safety and Ad Quality with Industry-Leading Partnership

SSP Group 12% as fast food chain's update reassures

SSP shared fall 2% after US bank downgrades; prefers WH Smith

SSP Group slips as low-end earnings per share expected

SSP Group: Business Is Improving But Valuation Still Looks High

FTSE 250 Stocks Round-Up: Tritax Eurobox, SSP Group

SSP Group back in profit as passenger numbers continue to recover
Source: https://incomestatements.info
Category: Stock Reports
