See more : Thunderful Group AB (THUNDR.ST) Income Statement Analysis – Financial Results
Complete financial analysis of Stem Holdings, Inc. (STMH) income statement, including revenue, profit margins, EPS and key performance metrics. Get detailed insights into the financial performance of Stem Holdings, Inc., a leading company in the Drug Manufacturers – Specialty & Generic industry within the Healthcare sector.
- LPA Group Plc (LPA.L) Income Statement Analysis – Financial Results
- AIAI Group Corporation (6557.T) Income Statement Analysis – Financial Results
- Latteys Industries Limited (LATTEYS.NS) Income Statement Analysis – Financial Results
- ZignSec AB (publ) (ZIGN.ST) Income Statement Analysis – Financial Results
- Athena Technology Acquisition Corp. II (ATEK-WT) Income Statement Analysis – Financial Results
Stem Holdings, Inc. (STMH)
Industry: Drug Manufacturers - Specialty & Generic
Sector: Healthcare
Website: https://stemholdings.com
About Stem Holdings, Inc.
Stem Holdings, Inc. operates as a vertically-integrated cannabis products and technology company. It engages in the production, distribution, and sale of cannabis and cannabis-infused products. The company's brands include TJ's Gardens, TravisxJames, and Yerba Buena flower and extracts; Cannavore edible confections; Doseology, a CBD mass-market brand; and delivery-as-a-service brands of Budee and Ganjarunner e-commerce platforms. As of September 30, 2021, it had ownership interests in 29 state issued cannabis licenses, including 9 licenses for cannabis cultivation; 3 licenses for cannabis processing; 2 licenses for cannabis wholesale distribution; 3 licenses for hemp production; 7 cannabis dispensary licenses; and 5 licenses for adult-use medical retailers. The company was incorporated in 2016 and is headquartered in Boca Raton, Florida.
| Metric | 2023 | 2022 | 2021 | 2020 | 2019 | 2018 | 2017 | 2016 |
|---|---|---|---|---|---|---|---|---|
| Revenue | 0.00 | 16.56M | 35.77M | 13.97M | 2.45M | 1.30M | 326.04K | 0.00 |
| Cost of Revenue | 0.00 | 14.44M | 28.18M | 10.31M | 1.94M | 7.56M | 0.00 | 0.00 |
| Gross Profit | 0.00 | 2.12M | 7.59M | 3.67M | 516.00K | -6.26M | 326.04K | 0.00 |
| Gross Profit Ratio | 0.00% | 12.82% | 21.21% | 26.25% | 21.05% | -483.44% | 100.00% | 0.00% |
| Research & Development | 0.00 | 0.00 | 0.00 | 0.00 | 0.00 | 0.00 | 0.00 | 0.00 |
| General & Administrative | 3.64M | 14.48M | 22.96M | 13.33M | 19.29M | 8.86M | 2.78M | 87.70K |
| Selling & Marketing | 103.00K | 266.00K | 368.00K | 0.00 | 0.00 | 0.00 | 0.00 | 0.00 |
| SG&A | 3.75M | 14.48M | 22.96M | 13.33M | 19.29M | 8.86M | 2.78M | 87.70K |
| Other Expenses | 0.00 | 1.97M | 2.30M | 0.00 | -40.00K | 44.39K | 0.00 | 0.00 |
| Operating Expenses | 3.75M | 14.48M | 22.96M | 13.33M | 19.29M | 8.86M | 2.78M | 87.70K |
| Cost & Expenses | 3.75M | 28.92M | 51.14M | 23.64M | 21.22M | 8.86M | 2.78M | 87.70K |
| Interest Income | 0.00 | 650.00K | 1.95M | 2.43M | 2.59M | 440.00 | 5.22K | 0.00 |
| Interest Expense | 1.24M | 650.00K | 1.88M | 2.43M | 2.59M | 345.66K | 975.00 | 0.00 |
| Depreciation & Amortization | -156.29K | 2.49M | 2.24M | 2.37M | 1.23M | 1.36M | 129.22K | 263.10K |
| EBITDA | -3.90M | -7.90M | -2.92M | -6.74M | -25.22M | -7.04M | -2.75M | -87.70K |
| EBITDA Ratio | 0.00% | -47.68% | -22.13% | -54.05% | -984.54% | -474.75% | -711.38% | 0.00% |
| Operating Income | -3.75M | -12.36M | -15.37M | -9.67M | -18.77M | -7.56M | -2.75M | -87.70K |
| Operating Income Ratio | 0.00% | -74.61% | -42.98% | -69.17% | -765.89% | -583.44% | -843.73% | 0.00% |
| Total Other Income/Expenses | -1.39M | -10.14M | 3.37M | -1.83M | -6.92M | -301.00K | 4.24K | -175.40K |
| Income Before Tax | -5.13M | -16.62M | -64.61M | -11.49M | -28.99M | -7.86M | -2.75M | -87.70K |
| Income Before Tax Ratio | 0.00% | -100.32% | -180.62% | -82.25% | -1,182.58% | -606.66% | -842.43% | 0.00% |
| Income Tax Expense | 0.00 | 10.78M | 3.71M | 1.69M | -7.69M | 44.83K | 975.00 | -263.10K |
| Net Income | -19.02M | -27.40M | -68.32M | -13.18M | -21.30M | -7.86M | -2.75M | -87.70K |
| Net Income Ratio | 0.00% | -165.40% | -190.99% | -94.34% | -868.87% | -606.66% | -842.43% | 0.00% |
| EPS | -5.92 | -12.11 | -42.88 | -21.92 | -75.40 | -94.64 | -49.07 | -3.27 |
| EPS Diluted | -5.92 | -12.11 | -42.88 | -21.92 | -75.40 | -94.64 | -49.07 | -3.27 |
| Weighted Avg Shares Out | 2.53M | 2.26M | 1.59M | 601.43K | 282.45K | 83.05K | 55.97K | 26.85K |
| Weighted Avg Shares Out (Dil) | 2.53M | 2.26M | 1.59M | 601.43K | 282.45K | 83.05K | 55.97K | 26.85K |

Stem Holdings Announces All Common Shares of ‘DRVD' will Trade Under symbol ‘STMH' on February 4, 2021.

Driven by Stem to Present at the NobleCon17 Annual Virtual Investor Conference on January 20th

Stem Holdings, Inc. Closes Acquisition of Driven Deliveries, Inc.

Stem Holdings Announces Pricing of Public Offering of Units

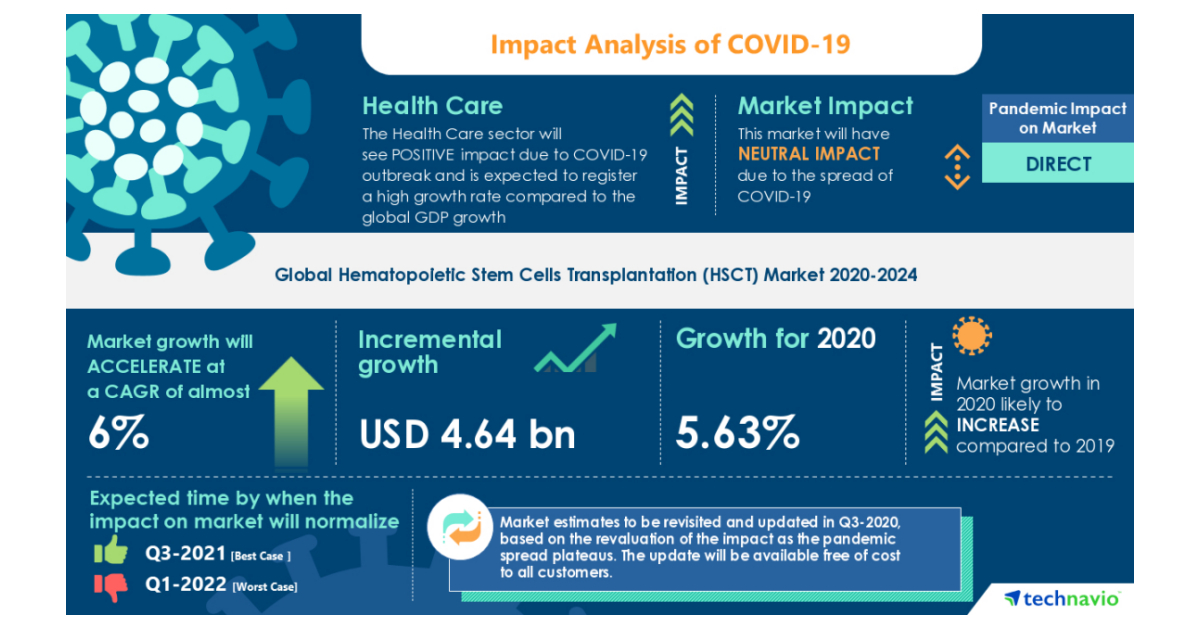
COVID-19 Impacts: Hematopoietic Stem Cells Transplantation (HSCT) Market will Accelerate at a CAGR of Almost 6% Through 2020-2024 | Demand for Personalized Medicine to Boost Growth | Technavio
Source: https://incomestatements.info
Category: Stock Reports
