See more : Wood Friends Co.,Ltd. (8886.T) Income Statement Analysis – Financial Results
Complete financial analysis of Stelco Holdings Inc. (STZHF) income statement, including revenue, profit margins, EPS and key performance metrics. Get detailed insights into the financial performance of Stelco Holdings Inc., a leading company in the Steel industry within the Basic Materials sector.
- PT Garda Tujuh Buana Tbk (GTBO.JK) Income Statement Analysis – Financial Results
- Hunan Hansen Pharmaceutical Co., Ltd. (002412.SZ) Income Statement Analysis – Financial Results
- Beter Bed Holding N.V. (BBED.AS) Income Statement Analysis – Financial Results
- Industrial & Commercial Bank of China Ltd. (IDCBY) Income Statement Analysis – Financial Results
- McBride plc (MCB.L) Income Statement Analysis – Financial Results
Stelco Holdings Inc. (STZHF)
About Stelco Holdings Inc.
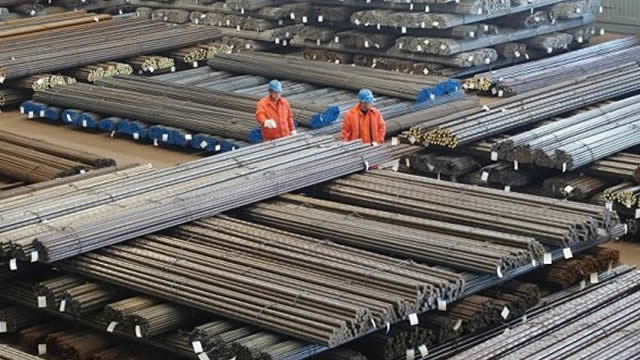
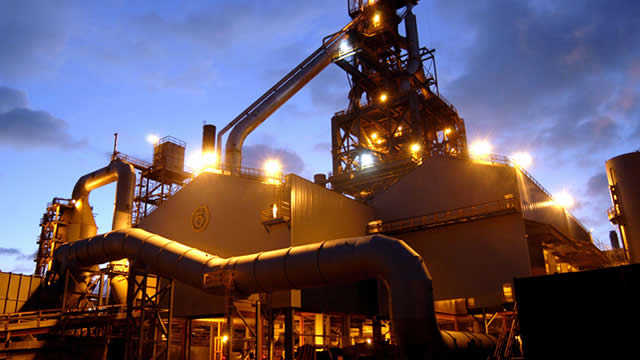
Stelco Holdings Inc. engages in the production and sale of steel products in Canada, the United States, and internationally. It offers flat-rolled value-added steel, including coated, pre-painted, cold-rolled, and hot-rolled sheet products, as well as pig iron and metallurgical coke. The company sells its products to customers in the construction, automotive, energy, appliance, and pipe and tube industries, as well as to various steel service centers. Stelco Holdings Inc. was founded in 1910 and is headquartered in Hamilton, Canada.
| Metric | 2023 | 2022 | 2021 | 2020 | 2019 | 2018 | 2017 | 2016 | 2015 | 2014 |
|---|---|---|---|---|---|---|---|---|---|---|
| Revenue | 2.92B | 3.46B | 4.12B | 1.52B | 1.84B | 2.46B | 788.00M | 1.30B | 1.35B | 1.89B |
| Cost of Revenue | 2.52B | 2.30B | 2.08B | 1.48B | 1.75B | 1.93B | 718.00M | 1.29B | 1.44B | 1.86B |
| Gross Profit | 400.00M | 1.16B | 2.04B | 41.00M | 96.00M | 532.00M | 70.00M | 15.00M | -93.00M | 38.00M |
| Gross Profit Ratio | 13.71% | 33.50% | 49.50% | 2.70% | 5.21% | 21.63% | 8.88% | 1.15% | -6.90% | 2.01% |
| Research & Development | 0.00 | 0.00 | 0.00 | 0.00 | 0.00 | 0.00 | 0.00 | 0.00 | 0.00 | 0.00 |
| General & Administrative | 22.00M | 75.00M | 58.00M | 48.00M | 46.00M | 56.00M | 7.00M | 0.00 | 0.00 | 0.00 |
| Selling & Marketing | 93.00M | 0.00 | 0.00 | 0.00 | 0.00 | 0.00 | 40.00M | 0.00 | 0.00 | 0.00 |
| SG&A | 115.00M | 75.00M | 58.00M | 48.00M | 46.00M | 56.00M | 47.00M | 24.00M | 28.00M | 44.00M |
| Other Expenses | 0.00 | -2.00M | -6.00M | 1.00M | 1.00M | 9.00M | 0.00 | 4.00M | 1.00M | 1.00M |
| Operating Expenses | 91.00M | 75.00M | 58.00M | 48.00M | 46.00M | 56.00M | 47.00M | 24.00M | 28.00M | 44.00M |
| Cost & Expenses | 2.61B | 2.38B | 2.14B | 1.52B | 1.79B | 1.98B | 765.00M | 1.31B | 1.47B | 1.90B |
| Interest Income | 3.00M | 26.00M | 1.00M | 2.00M | 6.00M | 4.00M | 0.00 | 1.00M | 1.00M | 1.00M |
| Interest Expense | 74.00M | 53.00M | 34.00M | 35.00M | 26.00M | 15.00M | 0.00 | 200.00M | 183.00M | 186.00M |
| Depreciation & Amortization | 124.00M | 90.00M | 69.00M | 66.00M | 51.00M | 35.00M | 14.00M | 29.00M | 27.00M | 25.00M |
| EBITDA | 397.00M | 1.16B | 1.93B | -21.00M | 90.00M | 342.00M | 169.50M | -7.00M | -179.00M | -22.00M |
| EBITDA Ratio | 13.61% | 33.50% | 46.42% | 2.37% | 4.89% | 13.66% | 4.70% | 1.77% | -6.98% | 0.95% |
| Operating Income | 309.00M | 1.09B | 1.98B | -30.00M | 39.00M | 476.00M | 23.00M | -9.00M | -121.00M | -6.00M |
| Operating Income Ratio | 10.59% | 31.33% | 48.10% | -1.98% | 2.12% | 19.35% | 2.92% | -0.69% | -8.98% | -0.32% |
| Total Other Income/Expenses | -110.00M | 175.00M | -201.00M | -152.00M | -30.00M | -223.00M | 5.34B | -227.00M | -268.00M | -227.00M |
| Income Before Tax | 199.00M | 1.26B | 1.78B | -159.00M | 20.00M | 253.00M | -14.00M | -236.00M | -389.00M | -233.00M |
| Income Before Tax Ratio | 6.82% | 36.38% | 43.22% | -10.48% | 1.09% | 10.28% | -1.78% | -18.13% | -28.88% | -12.31% |
| Income Tax Expense | 50.00M | 263.00M | 173.00M | 35.00M | 24.00M | 22.00M | 1.00M | 203.00M | 183.00M | 185.00M |
| Net Income | 149.00M | 997.00M | 1.61B | -194.00M | -4.00M | 253.00M | -15.00M | -236.00M | -389.00M | -233.00M |
| Net Income Ratio | 5.11% | 28.79% | 39.02% | -12.79% | -0.22% | 10.28% | -1.90% | -18.13% | -28.88% | -12.31% |
| EPS | 2.70 | 14.64 | 19.08 | -2.19 | -0.05 | 2.85 | -0.19 | -2.71 | -4.47 | -2.68 |
| EPS Diluted | 2.70 | 14.64 | 19.08 | -2.19 | -0.05 | 2.85 | -0.19 | -2.71 | -4.47 | -2.68 |
| Weighted Avg Shares Out | 55.13M | 68.12M | 84.34M | 88.71M | 88.75M | 88.81M | 79.03M | 87.05M | 87.05M | 87.05M |
| Weighted Avg Shares Out (Dil) | 55.13M | 68.12M | 84.34M | 88.71M | 88.75M | 88.81M | 79.03M | 87.05M | 87.05M | 87.05M |

Cleveland-Cliffs Announces Shareholder Approval of Arrangement to Acquire Stelco

Cleveland-Cliffs To Buy Canadian Steelmaker Stelco for $2.5 Billion

Cleveland Cliffs to buy Canadian steelmaker Stelco in $2.5 billion deal

Stelco Holdings Inc. (STZHF) Q1 2024 Earnings Call Transcript

Stelco Holdings Inc. Schedules First Quarter 2024 Earnings Release and Conference Call

Stelco Holdings Inc. Reports Fourth Quarter and Full Year 2023 Results

Stelco Holdings Inc. Schedules Fourth Quarter and Full-Year 2023 Earnings Release and Conference Call

Stelco Holdings Inc. (STZHF) Q3 2023 Earnings Call Transcript

Stelco Holdings Inc. Reports Third Quarter 2023 Results

Stelco Holdings Inc. Schedules Third Quarter 2023 Earnings Release and Conference Call
Source: https://incomestatements.info
Category: Stock Reports
