See more : Isabella Bank Corporation (ISBA) Income Statement Analysis – Financial Results
Complete financial analysis of TC Biopharm (Holdings) Plc (TCBP) income statement, including revenue, profit margins, EPS and key performance metrics. Get detailed insights into the financial performance of TC Biopharm (Holdings) Plc, a leading company in the Biotechnology industry within the Healthcare sector.
- VALUE CREATION CO LTD (9238.T) Income Statement Analysis – Financial Results
- Severfield plc (SFR.L) Income Statement Analysis – Financial Results
- AKM Industrial Company Limited (1639.HK) Income Statement Analysis – Financial Results
- Bezant Resources Plc (BZT.L) Income Statement Analysis – Financial Results
- Prakash Pipes Limited (PPL.NS) Income Statement Analysis – Financial Results
TC Biopharm (Holdings) Plc (TCBP)
About TC Biopharm (Holdings) Plc
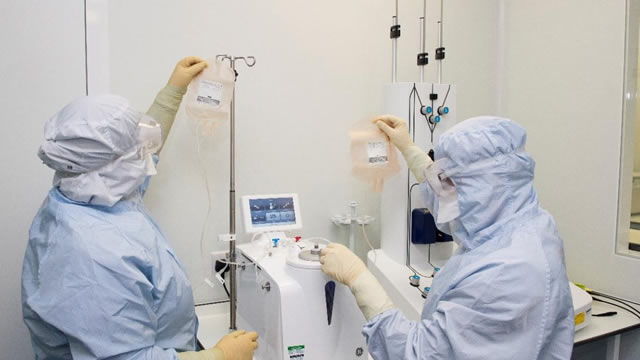
TC Biopharm (Holdings) Plc, a clinical-stage biopharmaceutical company, focuses on developing immunotherapy products based on its allogeneic gamma delta T cell platform. Its product pipeline includes OmnImmune, an unmodified cell therapy used in the treatment of acute myeloid leukemia; and ImmuniStim, an unmodified cell therapy to treat COVID-19. The company was founded in 2013 and is headquartered in Motherwell, the United Kingdom.
| Metric | 2023 | 2022 | 2021 | 2020 | 2019 |
|---|---|---|---|---|---|
| Revenue | 0.00 | 3.84M | 1.98M | 1.98M | 3.43M |
| Cost of Revenue | 0.00 | 0.00 | 0.00 | 0.00 | 0.00 |
| Gross Profit | 0.00 | 3.84M | 1.98M | 1.98M | 3.43M |
| Gross Profit Ratio | 0.00% | 100.00% | 100.00% | 100.00% | 100.00% |
| Research & Development | 7.77M | 7.59M | 6.16M | 6.68M | 8.61M |
| General & Administrative | 6.47M | 8.34M | 3.11M | 2.21M | 3.01M |
| Selling & Marketing | 402.31K | 402.31K | 0.00 | 0.00 | 0.00 |
| SG&A | 6.87M | 8.74M | 3.11M | 2.21M | 3.01M |
| Other Expenses | 0.00 | 0.00 | 0.00 | 0.00 | 0.00 |
| Operating Expenses | 6.91M | 124.90K | 13.52M | 8.32M | 10.07M |
| Cost & Expenses | 6.91M | 124.90K | 13.52M | 8.32M | 10.07M |
| Interest Income | 83.03K | 6.75M | 3.44M | 291.03K | 253.51K |
| Interest Expense | 0.00 | 6.75M | 3.44M | 292.06K | 275.41K |
| Depreciation & Amortization | 630.06K | 762.47K | 811.96K | 878.64K | 721.93K |
| EBITDA | -13.61M | -11.32M | -6.48M | -5.26M | -5.92M |
| EBITDA Ratio | 0.00% | -294.48% | -327.25% | -303.65% | -172.71% |
| Operating Income | -14.24M | -12.08M | -7.29M | -6.89M | -6.64M |
| Operating Income Ratio | 0.00% | -314.32% | -368.28% | -348.05% | -193.78% |
| Total Other Income/Expenses | 7.24M | 9.05M | -7.70M | -291.03K | -253.51K |
| Income Before Tax | -7.00M | -3.03M | -14.98M | -6.63M | -6.89M |
| Income Before Tax Ratio | 0.00% | -78.91% | -757.25% | -335.07% | -201.18% |
| Income Tax Expense | -1.09M | 1.72M | 1.41M | 1.17M | 826.07K |
| Net Income | -5.91M | -1.31M | -13.58M | -5.46M | -6.07M |
| Net Income Ratio | 0.00% | -34.17% | -686.12% | -275.84% | -177.07% |
| EPS | -191.21 | -382.31 | -6.95K | -2.88K | 0.00 |
| EPS Diluted | -191.21 | -382.31 | -6.95K | -2.88K | 0.00 |
| Weighted Avg Shares Out | 30.89K | 3.44K | 1.95K | 1.89K | 1.89K |
| Weighted Avg Shares Out (Dil) | 30.89K | 3.44K | 1.95K | 1.89K | 1.89K |

TC BioPharm Announces Grant Funding in Collaboration with Queen Mary University of London (QMUL)

Why Is TC BioPharm (TCBP) Stock Up Today?

TC BioPharm to Present at H.C. Wainwright 25th Annual Global Investment Conference

TC BioPharm Maintains Nasdaq Listing

3 Hot Penny Stocks To Watch After TUP Stock Explodes, Again

TC BioPharm to Present at the Sequire Investor Summit in Puerto Rico

Why Are TC Biopharm Shares Trading Higher Today

Trading Penny Stocks? Top Stock Market News for March 9th, 2022

Top Penny Stocks to Buy Right Now? 3 to Watch in Mid-February

U.S. IPO Weekly Recap: 3 Micro-Cap IPOs Come To Market During The February Lull
Source: https://incomestatements.info
Category: Stock Reports
