See more : Terra Firma Capital Corporation (TFCCF) Income Statement Analysis – Financial Results
Complete financial analysis of TELA Bio, Inc. (TELA) income statement, including revenue, profit margins, EPS and key performance metrics. Get detailed insights into the financial performance of TELA Bio, Inc., a leading company in the Medical – Devices industry within the Healthcare sector.
- Eco-Tek Holdings Limited (8169.HK) Income Statement Analysis – Financial Results
- Sonoma Pharmaceuticals, Inc. (SNOA) Income Statement Analysis – Financial Results
- National Bank of Canada (NA-PE.TO) Income Statement Analysis – Financial Results
- The Singing Machine Company, Inc. (MICS) Income Statement Analysis – Financial Results
- OM Holdings International, Inc. (OMHI) Income Statement Analysis – Financial Results
TELA Bio, Inc. (TELA)
About TELA Bio, Inc.
TELA Bio, Inc., a commercial-stage medical technology company, focuses on providing soft-tissue reconstruction solutions that optimize clinical outcomes by prioritizing the preservation and restoration of the patient's anatomy. It provides a portfolio of OviTex Reinforced Tissue Matrix (OviTex) products for hernia repair and abdominal wall reconstruction; and OviTex PRS Reinforced Tissue Matrix products to address the unmet needs in plastic and reconstructive surgery, as well as OviTex for Laparoscopic and Robotic Procedures, a sterile reinforced tissue matrix derived from ovine rumen with polypropylene fiber intended to be used in laparoscopic and robotic-assisted hernia surgical repairs. The company markets its products through a single direct sales force, principally in the United States. TELA Bio, Inc. was incorporated in 2012 and is headquartered in Malvern, Pennsylvania.
| Metric | 2023 | 2022 | 2021 | 2020 | 2019 | 2018 | 2017 |
|---|---|---|---|---|---|---|---|
| Revenue | 58.45M | 41.42M | 29.46M | 18.21M | 15.45M | 8.27M | 4.25M |
| Cost of Revenue | 18.34M | 14.37M | 10.65M | 6.98M | 6.17M | 5.33M | 1.71M |
| Gross Profit | 40.11M | 27.04M | 18.81M | 11.23M | 9.27M | 2.94M | 2.53M |
| Gross Profit Ratio | 68.62% | 65.30% | 63.85% | 61.68% | 60.03% | 35.56% | 59.65% |
| Research & Development | 9.62M | 8.94M | 6.74M | 4.26M | 4.15M | 4.34M | 5.79M |
| General & Administrative | 14.89M | 13.86M | 12.46M | 10.14M | 6.22M | 4.90M | 4.96M |
| Selling & Marketing | 59.68M | 43.25M | 29.06M | 22.11M | 18.06M | 13.65M | 8.71M |
| SG&A | 74.57M | 57.11M | 41.52M | 32.25M | 24.28M | 18.55M | 13.67M |
| Other Expenses | 0.00 | -10.00K | -228.00K | 45.00K | 351.00K | 70.00K | 94.00K |
| Operating Expenses | 84.19M | 66.05M | 48.26M | 36.51M | 28.43M | 22.88M | 19.46M |
| Cost & Expenses | 102.53M | 80.43M | 58.91M | 43.49M | 34.61M | 28.22M | 21.17M |
| Interest Income | 0.00 | 4.05M | 3.60M | 3.56M | 3.61M | 0.00 | 0.00 |
| Interest Expense | 5.22M | 4.05M | 3.60M | 3.56M | 3.61M | 1.80M | 4.56M |
| Depreciation & Amortization | 808.00K | 1.19M | 535.00K | 525.00K | 582.00K | 1.25M | 761.00K |
| EBITDA | -40.63M | -39.06M | -29.14M | -24.71M | -18.23M | -18.04M | -16.02M |
| EBITDA Ratio | -69.51% | -94.20% | -100.73% | -138.53% | -121.79% | -225.09% | -378.54% |
| Operating Income | -44.08M | -39.01M | -29.45M | -25.28M | -19.16M | -17.78M | -16.92M |
| Operating Income Ratio | -75.40% | -94.18% | -99.96% | -138.77% | -124.06% | -214.91% | -398.68% |
| Total Other Income/Expenses | -2.59M | -5.29M | -3.83M | -3.52M | -3.26M | -3.31M | -4.41M |
| Income Before Tax | -46.66M | -44.30M | -33.28M | -28.79M | -22.43M | -21.09M | -21.33M |
| Income Before Tax Ratio | -79.83% | -106.95% | -112.94% | -158.10% | -145.18% | -254.92% | -502.57% |
| Income Tax Expense | 0.00 | 41.00K | 2.83M | 3.08M | 3.38M | -1.51M | 4.65M |
| Net Income | -46.66M | -44.34M | -36.11M | -31.88M | -25.80M | -21.09M | -21.33M |
| Net Income Ratio | -79.83% | -107.05% | -122.56% | -175.03% | -167.05% | -254.92% | -502.57% |
| EPS | -2.04 | -2.73 | -2.49 | -2.46 | -2.26 | -3.25 | -3.29 |
| EPS Diluted | -2.04 | -2.73 | -2.49 | -2.46 | -2.26 | -3.25 | -3.29 |
| Weighted Avg Shares Out | 22.87M | 16.27M | 14.47M | 12.93M | 11.41M | 6.49M | 6.49M |
| Weighted Avg Shares Out (Dil) | 22.87M | 16.27M | 14.47M | 12.93M | 11.41M | 6.49M | 6.49M |

Truecaller apresenta identificador de chamadas ao vivo para iPhone

TELA Bio, Inc. (TELA) Q4 2022 Earnings Call Transcript

TELA Bio, Inc. (TELA) Reports Q4 Loss, Lags Revenue Estimates
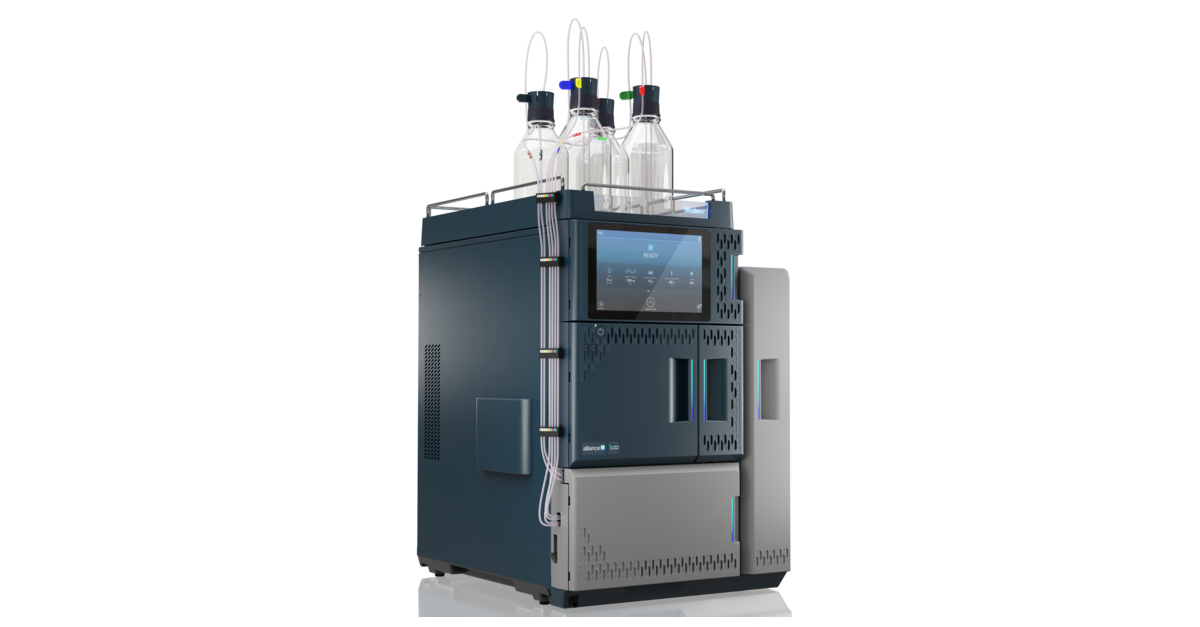
Waters apresenta sistema de HPLC Alliance iS de próxima geração destinado a reduzir até 40% dos erros comuns de laboratório
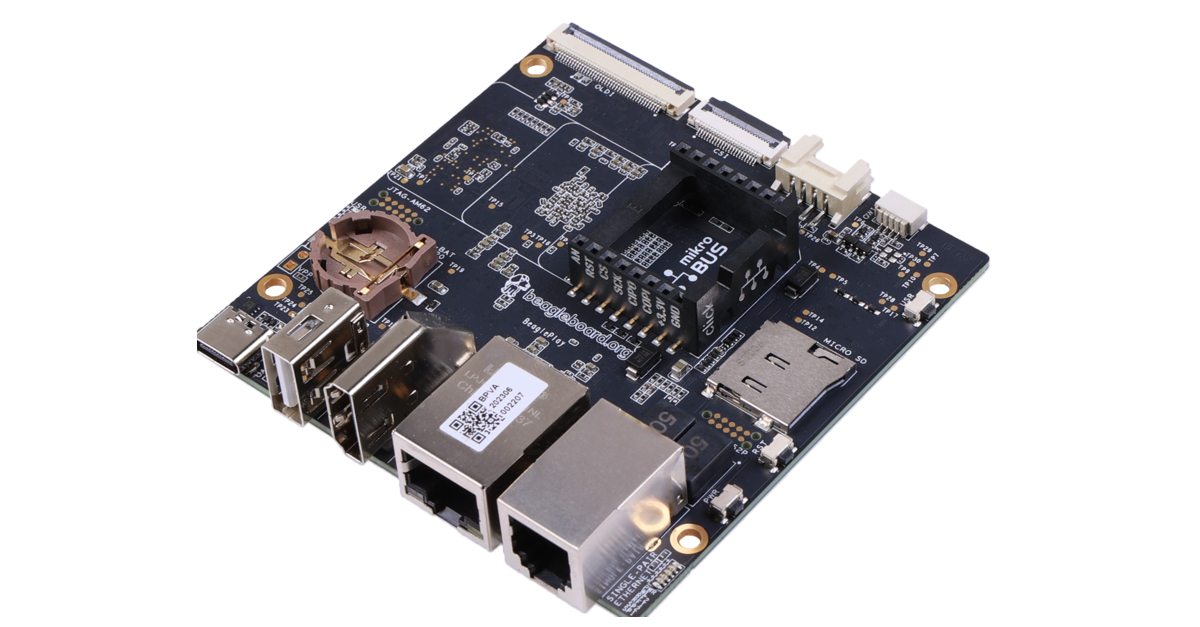
BeaglePlay® da BeagleBoard.org® oferece diversão à construção de computadores
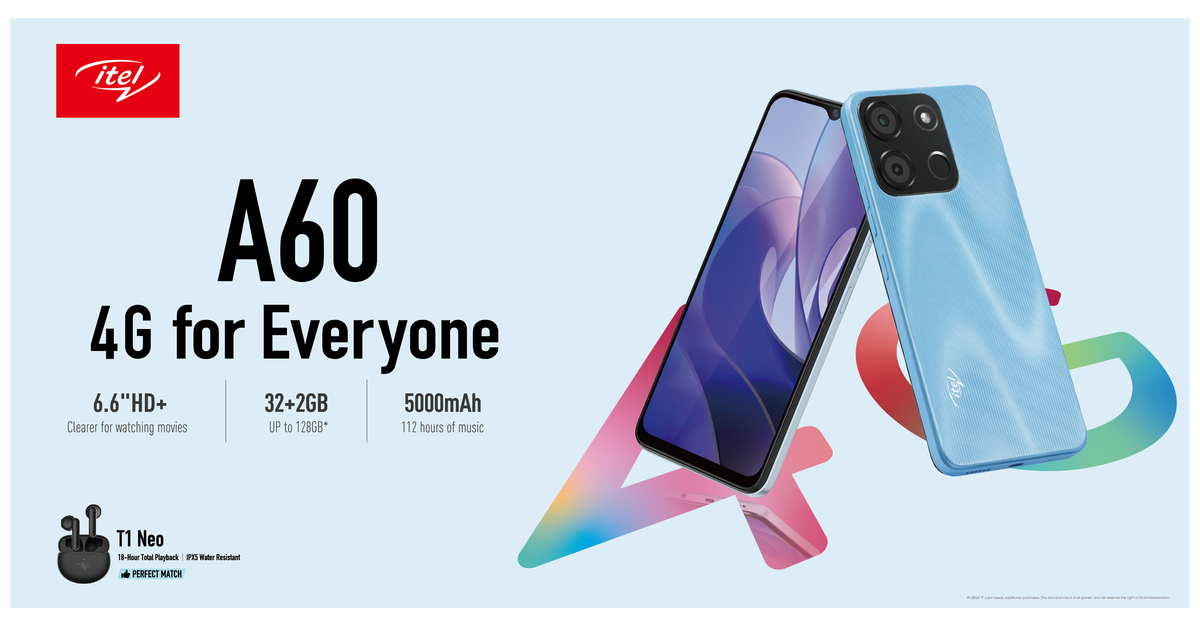
itel lança smartphone A60 econômico na África em cooperação com operadoras

LambdaTest faz parceria com LinkedIn para oferecer Certificado Profissional de Automação de Testes no LinkedIn Learning

TELA Bio to Announce Fourth Quarter and Full Year 2022 Financial Results

Posiflex apresentará o primeiro POS com design clamshell do setor na EuroShop 2023 e visa redefinir a eficiência dos negócios

Grupo Lenovo: resultados do terceiro trimestre 2022/23
Source: https://incomestatements.info
Category: Stock Reports
