Complete financial analysis of Thor Mining PLC (THORF) income statement, including revenue, profit margins, EPS and key performance metrics. Get detailed insights into the financial performance of Thor Mining PLC, a leading company in the Industrial Materials industry within the Basic Materials sector.
- Nestlé India Limited (NESTLEIND.NS) Income Statement Analysis – Financial Results
- TC Energy Corporation (TNCAF) Income Statement Analysis – Financial Results
- Kaizen Platform, Inc. (4170.T) Income Statement Analysis – Financial Results
- The Social Chain AG (PU11.DE) Income Statement Analysis – Financial Results
- Eastcoast Steel Limited (ECSTSTL.BO) Income Statement Analysis – Financial Results
Thor Mining PLC (THORF)
About Thor Mining PLC
Thor Mining PLC engages in the exploration and development of mineral properties in Australia and the United States. It explores for tungsten, molybdenum, copper, uranium, vanadium, gold, lithium, and nickel deposits. The company holds 100% interests in the Molyhil tungsten-molybdenum project located in the Northern Territory of Australia; the Uranium and Vanadium project situated in the Colorado and Utah; and the Ragged Range project located in Eastern Pilbara Craton, Western Australia. It also holds interests in the Kapunda copper mine; the Alford East copper project; and the EnviroCopper copper projects located in South Australia. Thor Mining PLC was incorporated in 2004 and is headquartered in London, the United Kingdom.
| Metric | 2024 | 2023 | 2022 | 2021 | 2020 | 2019 | 2018 | 2017 | 2016 | 2015 | 2014 | 2013 | 2012 | 2011 | 2010 | 2009 | 2008 | 2007 | 2006 | 2005 |
|---|---|---|---|---|---|---|---|---|---|---|---|---|---|---|---|---|---|---|---|---|
| Revenue | 0.00 | 0.00 | 0.00 | 0.00 | 0.00 | 0.00 | 0.00 | 0.00 | 0.00 | 0.00 | 0.00 | 0.00 | 0.00 | 0.00 | 0.00 | 0.00 | 0.00 | 0.00 | 0.00 | 0.00 |
| Cost of Revenue | 0.00 | 30.00K | 15.00K | 38.00K | 37.00K | 8.00K | 9.00K | 4.00K | 13.00K | 0.00 | 0.00 | 0.00 | 0.00 | 0.00 | 0.00 | 0.00 | 0.00 | 0.00 | 0.00 | 0.00 |
| Gross Profit | 0.00 | -30.00K | -15.00K | -38.00K | -37.00K | -8.00K | -9.00K | -4.00K | -13.00K | 0.00 | 0.00 | 0.00 | 0.00 | 0.00 | 0.00 | 0.00 | 0.00 | 0.00 | 0.00 | 0.00 |
| Gross Profit Ratio | 0.00% | 0.00% | 0.00% | 0.00% | 0.00% | 0.00% | 0.00% | 0.00% | 0.00% | 0.00% | 0.00% | 0.00% | 0.00% | 0.00% | 0.00% | 0.00% | 0.00% | 0.00% | 0.00% | 0.00% |
| Research & Development | 0.00 | 0.00 | 0.00 | 0.00 | 0.00 | 0.00 | 0.00 | 0.00 | 0.00 | 0.00 | 0.00 | 0.00 | 0.00 | 0.00 | 0.00 | 0.00 | 0.00 | 0.00 | 0.00 | 0.00 |
| General & Administrative | 633.00K | 146.00K | 112.00K | 94.00K | 123.00K | 91.00K | 92.00K | 86.00K | 71.00K | 89.00K | 136.00K | 131.00K | 157.00K | 175.00K | 164.00K | 449.00K | 553.00K | 323.00K | 137.00K | 0.00 |
| Selling & Marketing | 28.00K | 535.00K | 0.00 | 0.00 | 0.00 | 0.00 | 0.00 | 0.00 | 0.00 | 0.00 | 0.00 | 0.00 | 0.00 | 0.00 | 0.00 | 0.00 | 0.00 | 0.00 | 0.00 | 0.00 |
| SG&A | 661.00K | 681.00K | 112.00K | 94.00K | 123.00K | 91.00K | 92.00K | 86.00K | 71.00K | 89.00K | 136.00K | 131.00K | 157.00K | 175.00K | 164.00K | 449.00K | 553.00K | 323.00K | 137.00K | 0.00 |
| Other Expenses | 1.91M | 64.00K | 71.00K | 41.00K | 38.00K | 17.00K | 0.00 | 8.00K | 0.00 | 0.00 | 0.00 | 0.00 | 0.00 | 0.00 | 0.00 | 0.00 | 0.00 | 0.00 | 0.00 | 0.00 |
| Operating Expenses | 2.57M | 681.00K | 1.05M | 936.00K | 859.00K | 735.00K | 1.26M | 842.00K | 667.00K | 752.00K | 634.00K | 865.00K | 745.00K | 1.02M | 616.00K | 1.03M | 1.22M | 1.51M | 724.00K | 99.00K |
| Cost & Expenses | 2.57M | 711.00K | 1.05M | 936.00K | 859.00K | 735.00K | 1.26M | 842.00K | 667.00K | 752.00K | 634.00K | 865.00K | 745.00K | 1.02M | 616.00K | 1.03M | 1.22M | 1.51M | 724.00K | 99.00K |
| Interest Income | 0.00 | 4.00K | 0.00 | 0.00 | 2.00K | 12.00K | 13.00K | 0.00 | 0.00 | 2.00K | 3.00K | 7.00K | 30.00K | 32.00K | 5.00K | 27.00K | 104.00K | 126.00K | 33.00K | 0.00 |
| Interest Expense | 0.00 | 3.00K | 2.00K | 1.00K | 4.00K | 0.00 | 1.00K | 0.00 | 47.00K | 37.00K | 39.00K | 0.00 | 0.00 | 0.00 | 0.00 | 0.00 | 0.00 | 0.00 | 0.00 | 0.00 |
| Depreciation & Amortization | 1.92M | 30.00K | 15.00K | 38.00K | 37.00K | 8.00K | 9.00K | 4.00K | 13.00K | 20.00K | 23.00K | 27.00K | 23.00K | 23.00K | 26.00K | 28.00K | 39.00K | 29.00K | 3.00K | 0.00 |
| EBITDA | -647.00K | -681.00K | -1.04M | -835.00K | -852.00K | -727.00K | -1.24M | -830.00K | -654.00K | -730.00K | -608.00K | -572.00K | -478.00K | -1.00M | -640.00K | -950.00K | -1.04M | -1.36M | -681.00K | -99.00K |
| EBITDA Ratio | 0.00% | 0.00% | 0.00% | 0.00% | 0.00% | 0.00% | 0.00% | 0.00% | 0.00% | 0.00% | 0.00% | 0.00% | 0.00% | 0.00% | 0.00% | 0.00% | 0.00% | 0.00% | 0.00% | 0.00% |
| Operating Income | -2.57M | -711.00K | -971.00K | -2.39M | -912.00K | -764.00K | -1.27M | -1.26M | -1.70M | -880.00K | -744.00K | -1.13M | -989.00K | -2.84M | -1.71M | -1.29M | -1.22M | -1.51M | -724.00K | -99.00K |
| Operating Income Ratio | 0.00% | 0.00% | 0.00% | 0.00% | 0.00% | 0.00% | 0.00% | 0.00% | 0.00% | 0.00% | 0.00% | 0.00% | 0.00% | 0.00% | 0.00% | 0.00% | 0.00% | 0.00% | 0.00% | 0.00% |
| Total Other Income/Expenses | 92.00K | 191.00K | -282.00K | 284.00K | -10.00K | 29.00K | 22.00K | 8.00K | -47.00K | -35.00K | -36.00K | 19.00K | 30.00K | -11.00K | -50.00K | 56.00K | 141.00K | 126.00K | 40.00K | 0.00 |
| Income Before Tax | -2.47M | -493.00K | -1.25M | -2.10M | -922.00K | -735.00K | -1.25M | -1.25M | -1.75M | -915.00K | -780.00K | -1.12M | -959.00K | -2.85M | -1.76M | -1.23M | -1.08M | -1.39M | -684.00K | -99.00K |
| Income Before Tax Ratio | 0.00% | 0.00% | 0.00% | 0.00% | 0.00% | 0.00% | 0.00% | 0.00% | 0.00% | 0.00% | 0.00% | 0.00% | 0.00% | 0.00% | 0.00% | 0.00% | 0.00% | 0.00% | 0.00% | 0.00% |
| Income Tax Expense | 0.00 | 27.00K | -6.00K | 1.52M | 93.00K | 58.00K | 23.00K | 427.00K | 1.03M | 130.00K | 113.00K | 532.00K | 488.00K | 1.81M | 1.05M | 308.00K | 141.00K | 126.00K | 40.00K | 0.00 |
| Net Income | -2.47M | -520.00K | -1.25M | -2.10M | -922.00K | -735.00K | -1.25M | -1.25M | -1.75M | -915.00K | -780.00K | -1.12M | -959.00K | -2.85M | -1.76M | -1.23M | -1.08M | -1.39M | -684.00K | -99.00K |
| Net Income Ratio | 0.00% | 0.00% | 0.00% | 0.00% | 0.00% | 0.00% | 0.00% | 0.00% | 0.00% | 0.00% | 0.00% | 0.00% | 0.00% | 0.00% | 0.00% | 0.00% | 0.00% | 0.00% | 0.00% | 0.00% |
| EPS | -0.01 | 0.00 | -0.01 | -0.01 | -0.01 | -0.01 | 0.00 | 0.00 | -0.01 | -0.01 | -0.01 | -0.03 | -0.04 | -0.16 | -0.20 | -0.19 | -0.19 | -0.30 | -0.84 | -0.12 |
| EPS Diluted | -0.01 | 0.00 | -0.01 | -0.01 | -0.01 | -0.01 | 0.00 | 0.00 | -0.01 | -0.01 | -0.01 | -0.03 | -0.04 | -0.16 | -0.20 | -0.19 | -0.19 | -0.30 | -0.84 | -0.12 |
| Weighted Avg Shares Out | 272.68M | 222.80M | 201.43M | 149.72M | 99.04M | 71.41M | 545.37M | 315.18M | 172.62M | 110.77M | 54.47M | 35.45M | 25.75M | 17.52M | 8.91M | 6.37M | 5.65M | 4.56M | 810.61K | 858.13K |
| Weighted Avg Shares Out (Dil) | 272.67M | 222.80M | 201.43M | 149.72M | 99.04M | 71.41M | 545.37M | 315.18M | 172.62M | 110.77M | 54.47M | 35.45M | 25.75M | 17.52M | 8.91M | 6.37M | 5.65M | 4.56M | 810.61K | 858.13K |
Thor Energy upbeat on exploration as uranium prices climb

Thor Energy unearths high-grade uranium and vanadium in Colorado

Thor Energy looks forward to US drill results as uranium price soars

Thor Energy: Alligator completes ECL buy-in
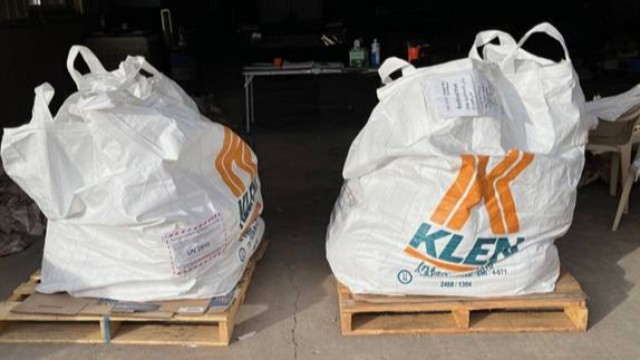
Thor Energy sees high grade uranium in recent drill results

Thor Energy sitting pretty amid uranium renaissance - analyst
Thor Energy associate consolidates assets at Alford West
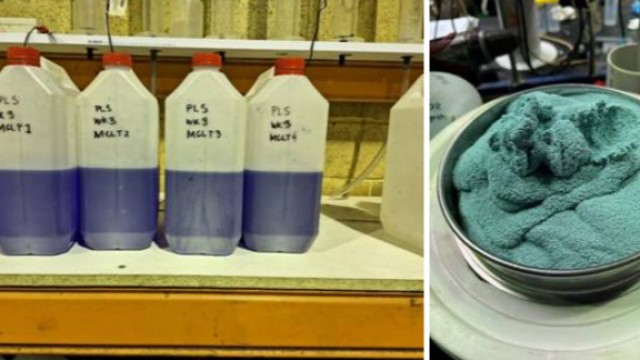
Thor Energy sees ‘favourable' copper recoveries in testing
Thor Energy MD discuss uranium discoveries and plans - ICYMI

Thor Energy confirms shallow, high-grade uranium at project in Colorado
Source: https://incomestatements.info
Category: Stock Reports
