See more : Indigo Paints Limited (INDIGOPNTS.NS) Income Statement Analysis – Financial Results
Complete financial analysis of Thor Explorations Ltd. (THXPF) income statement, including revenue, profit margins, EPS and key performance metrics. Get detailed insights into the financial performance of Thor Explorations Ltd., a leading company in the Gold industry within the Basic Materials sector.
- Lithium Americas (Argentina) Corp. (LAAC) Income Statement Analysis – Financial Results
- Viking Therapeutics, Inc. (VKTX) Income Statement Analysis – Financial Results
- Unic-tech, Limited Partnership (UNTC.TA) Income Statement Analysis – Financial Results
- The Boeing Company (BA.SW) Income Statement Analysis – Financial Results
- Endurance RP Limited (0575.HK) Income Statement Analysis – Financial Results
Thor Explorations Ltd. (THXPF)
About Thor Explorations Ltd.
Thor Explorations Ltd., a natural resources company, engages in the acquisition, exploration, development, and production of mineral properties in Senegal, Burkina Faso, Nigeria, and Canada. The company primarily explores for gold and silver deposits. Its flagship property is the Segilola gold project located in Osun State, Nigeria. The company was incorporated in 1968 and is based in Vancouver, Canada.
| Metric | 2023 | 2022 | 2021 | 2020 | 2019 | 2018 | 2017 | 2016 | 2015 | 2014 | 2013 | 2012 | 2011 | 2010 | 2009 | 2008 | 2007 | 2006 | 2005 | 2004 | 2003 | 2002 | 2001 |
|---|---|---|---|---|---|---|---|---|---|---|---|---|---|---|---|---|---|---|---|---|---|---|---|
| Revenue | 141.25M | 165.17M | 7.82M | 0.00 | 0.00 | 0.00 | 0.00 | 0.00 | 0.00 | 0.00 | 0.00 | 0.00 | 0.00 | 0.00 | 0.00 | 0.00 | 0.00 | 0.00 | 0.00 | 0.00 | 0.00 | 0.00 | 0.00 |
| Cost of Revenue | 102.57M | 107.92M | 5.31M | 112.34K | 126.73K | 50.92K | 25.32K | 1.71K | 2.15K | 1.97K | 1.71K | 1.08K | 0.00 | 0.00 | 0.00 | 0.00 | 0.00 | 0.00 | 0.00 | 0.00 | 0.00 | 0.00 | 0.00 |
| Gross Profit | 38.68M | 57.25M | 2.51M | -112.34K | -126.73K | -50.92K | -25.32K | -1.71K | -2.15K | -1.97K | -1.71K | -1.08K | 0.00 | 0.00 | 0.00 | 0.00 | 0.00 | 0.00 | 0.00 | 0.00 | 0.00 | 0.00 | 0.00 |
| Gross Profit Ratio | 27.38% | 34.66% | 32.05% | 0.00% | 0.00% | 0.00% | 0.00% | 0.00% | 0.00% | 0.00% | 0.00% | 0.00% | 0.00% | 0.00% | 0.00% | 0.00% | 0.00% | 0.00% | 0.00% | 0.00% | 0.00% | 0.00% | 0.00% |
| Research & Development | 0.00 | 0.00 | 0.00 | 0.00 | 0.00 | 0.00 | 0.00 | 0.00 | 0.00 | 0.00 | 0.00 | 0.00 | 0.00 | 0.00 | 0.00 | 0.00 | 0.00 | 0.00 | 0.00 | 0.00 | 0.00 | 0.00 | 0.00 |
| General & Administrative | 10.75M | 15.62M | 3.93M | 5.04M | 2.43M | 3.70M | 2.20M | 501.78K | 502.85K | 523.54K | 796.74K | 997.84K | 777.93K | 97.35K | 431.21K | 223.68K | 347.83K | 56.62K | 49.24K | 48.51K | 48.42K | 38.99K | 0.00 |
| Selling & Marketing | 0.00 | 0.00 | 0.00 | 0.00 | 0.00 | 0.00 | 0.00 | 0.00 | 0.00 | 0.00 | 0.00 | 0.00 | 0.00 | 0.00 | 0.00 | 0.00 | 10.84K | 18.76K | 18.14K | 18.44K | 19.02K | 16.98K | 0.00 |
| SG&A | 10.75M | 15.62M | 3.93M | 5.04M | 2.43M | 3.70M | 2.20M | 501.78K | 502.85K | 523.54K | 796.74K | 997.84K | 777.93K | 97.35K | 431.21K | 223.68K | 358.67K | 75.37K | 67.38K | 66.95K | 67.44K | 55.96K | 61.92K |
| Other Expenses | 3.99M | 0.00 | 0.00 | 1.04M | 0.00 | 0.00 | 0.00 | 0.00 | 0.00 | 0.00 | 0.00 | 0.00 | 0.00 | 0.00 | 0.00 | 0.00 | 0.00 | 0.00 | 0.00 | 0.00 | 0.00 | 0.00 | 0.00 |
| Operating Expenses | 14.74M | 16.96M | 4.01M | 5.04M | 2.43M | 3.70M | 2.23M | 501.78K | 502.85K | 523.54K | 796.74K | 997.84K | 777.93K | 97.35K | 431.21K | 223.68K | 358.67K | 75.37K | 67.38K | 66.95K | 67.44K | 55.96K | 61.92K |
| Cost & Expenses | 117.30M | 124.88M | 9.32M | 5.15M | 2.55M | 3.75M | 2.23M | 503.48K | 505.00K | 525.50K | 798.45K | 998.91K | 777.93K | 97.35K | 431.21K | 223.68K | 358.67K | 75.37K | 67.38K | 66.95K | 67.44K | 55.96K | 61.92K |
| Interest Income | 0.00 | 0.00 | 0.00 | 0.00 | 0.00 | 0.00 | 0.00 | 0.00 | 0.00 | 0.00 | 76.00 | 1.82K | 28.20K | 22.02K | 26.78K | 57.94K | 0.00 | 0.00 | 0.00 | 0.00 | 0.00 | 0.00 | 0.00 |
| Interest Expense | 13.11M | 14.62M | 82.04K | 3.16K | 65.18K | 35.45K | 0.00 | 136.10K | 0.00 | 0.00 | 0.00 | 0.00 | 178.93K | 0.00 | 941.00 | 407.00 | 0.00 | 0.00 | 0.00 | 0.00 | 0.00 | 0.00 | 0.00 |
| Depreciation & Amortization | 28.24M | 31.65M | 106.19K | 88.10K | 97.02K | 37.39K | 31.84K | 1.27K | 2.15K | 1.97K | 1.71K | 1.08K | 24.19K | 1.00 | 0.00 | 0.00 | 0.00 | 0.00 | 0.00 | 0.00 | 0.00 | 0.00 | 0.00 |
| EBITDA | 52.22M | 85.06M | -1.95M | -4.07M | -4.52M | -3.98M | -2.18M | -507.73K | -515.80K | -530.26K | -790.73K | -1.01M | -753.74K | -97.35K | -427.95K | -73.06K | -358.67K | -75.37K | -67.38K | -66.95K | -67.44K | -55.96K | -61.92K |
| EBITDA Ratio | 36.97% | 43.40% | -21.63% | 0.00% | 0.00% | 0.00% | 0.00% | 0.00% | 0.00% | 0.00% | 0.00% | 0.00% | 0.00% | 0.00% | 0.00% | 0.00% | 0.00% | 0.00% | 0.00% | 0.00% | 0.00% | 0.00% | 0.00% |
| Operating Income | 23.94M | 40.02M | -1.90M | -3.70M | -4.84M | -4.17M | -2.66M | -642.44K | -505.00K | -527.25K | -816.25K | -1.04M | -777.93K | -97.35K | -427.95K | -73.06K | -358.67K | -75.37K | -67.38K | -66.95K | -67.44K | -55.96K | -61.92K |
| Operating Income Ratio | 16.95% | 24.23% | -24.29% | 0.00% | 0.00% | 0.00% | 0.00% | 0.00% | 0.00% | 0.00% | 0.00% | 0.00% | 0.00% | 0.00% | 0.00% | 0.00% | 0.00% | 0.00% | 0.00% | 0.00% | 0.00% | 0.00% | 0.00% |
| Total Other Income/Expenses | -13.07M | -886.31K | -1.02M | 646.37K | -65.18K | -35.45K | 0.00 | -208.22K | -10.08K | -22.90K | 76.00 | 1.82K | -151.10K | 21.70K | -3.26K | -150.63K | 0.00 | 0.00 | 0.00 | 0.00 | 0.00 | 0.00 | 0.00 |
| Income Before Tax | 10.87M | 25.40M | -2.58M | -3.90M | -4.90M | -4.21M | -2.66M | -850.66K | -496.83K | -527.25K | -816.18K | -1.04M | -929.03K | -75.65K | -431.21K | -223.68K | 0.00 | 0.00 | 0.00 | 0.00 | 0.00 | 0.00 | 0.00 |
| Income Before Tax Ratio | 7.70% | 15.38% | -33.02% | 0.00% | 0.00% | 0.00% | 0.00% | 0.00% | 0.00% | 0.00% | 0.00% | 0.00% | 0.00% | 0.00% | 0.00% | 0.00% | 0.00% | 0.00% | 0.00% | 0.00% | 0.00% | 0.00% | 0.00% |
| Income Tax Expense | 0.00 | 14.62M | -68.85K | -29.86K | -15.21K | -17.03K | -11.83K | -3.35K | -35.62K | -50.20K | 6.27K | 108.44K | 154.73K | -21.70K | -22.58K | 93.10K | 338.94K | 71.31K | 67.07K | 66.37K | 66.83K | 55.82K | 61.18K |
| Net Income | 10.87M | 25.40M | -2.51M | -3.87M | -4.89M | -4.19M | -2.65M | -847.31K | -461.21K | -476.94K | -822.45K | -1.15M | -929.03K | -75.65K | -408.63K | -316.78K | -338.94K | -71.31K | -67.07K | -66.37K | -66.83K | -55.82K | -61.18K |
| Net Income Ratio | 7.70% | 15.38% | -32.14% | 0.00% | 0.00% | 0.00% | 0.00% | 0.00% | 0.00% | 0.00% | 0.00% | 0.00% | 0.00% | 0.00% | 0.00% | 0.00% | 0.00% | 0.00% | 0.00% | 0.00% | 0.00% | 0.00% | 0.00% |
| EPS | 0.02 | 0.04 | 0.00 | -0.01 | -0.01 | -0.01 | -0.01 | -0.01 | 0.00 | 0.00 | -0.01 | -0.02 | -0.03 | 0.00 | -0.02 | -0.02 | -0.02 | -0.01 | -0.01 | -0.01 | -0.01 | -0.01 | -0.01 |
| EPS Diluted | 0.02 | 0.04 | 0.00 | -0.01 | -0.01 | -0.01 | -0.01 | -0.01 | 0.00 | 0.00 | -0.01 | -0.02 | -0.03 | 0.00 | -0.02 | -0.02 | -0.02 | -0.01 | -0.01 | -0.01 | -0.01 | -0.01 | -0.01 |
| Weighted Avg Shares Out | 655.69M | 641.96M | 625.37M | 549.38M | 376.50M | 335.08M | 294.85M | 170.67M | 105.92M | 98.24M | 87.93M | 67.88M | 36.68M | 35.32M | 20.36M | 15.67M | 22.31M | 14.08M | 11.98M | 11.75M | 9.98M | 9.98M | 9.98M |
| Weighted Avg Shares Out (Dil) | 658.16M | 650.32M | 625.37M | 549.38M | 376.50M | 335.08M | 294.85M | 170.67M | 105.92M | 98.24M | 87.93M | 67.88M | 36.68M | 35.32M | 20.36M | 15.67M | 22.31M | 14.08M | 11.98M | 11.75M | 9.98M | 9.98M | 9.98M |

Thor Explorations says cash flow will be freed up as it announces amendments and rescheduling of senior debt

Thor Explorations achieves 2022 production at top end of guidance as Segilola ramps up

Thor Explorations rounds out 2022 with fresh drill results from Douta Gold Project
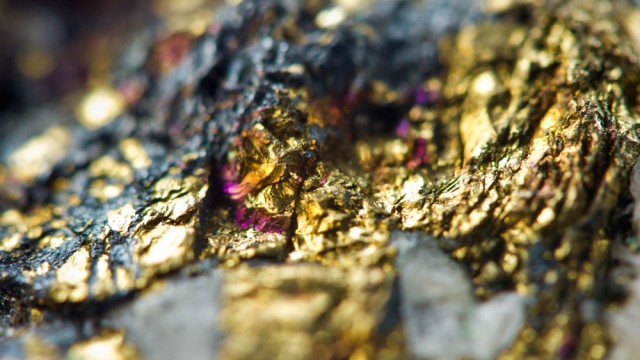
Thor Explorations reports drill-intersections of significant gold mineralisation from the Makosa gold deposit in Senegal

Thor Explorations reports steady production at its Nigeria gold mine as it posts third quarter numbers
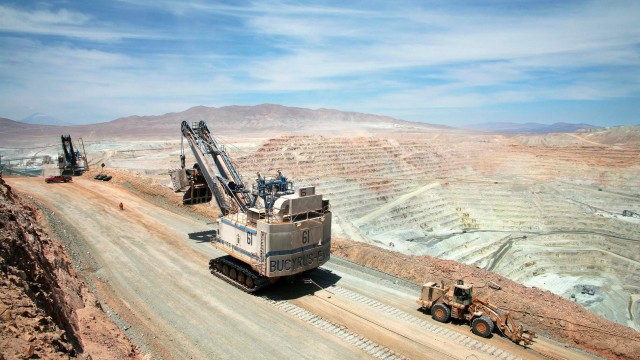
Mining Stocks Round-Up: Ferrexpo, Tharisa, Thor Explorations
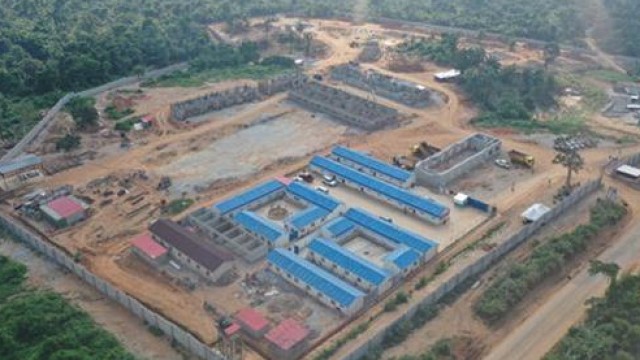
Thor Explorations updates on Segilola Gold Mine in Nigeria; highlights record Q3 production

Thor Explorations turns to profit in H122 as its gold mine in Nigeria achieves commercial production
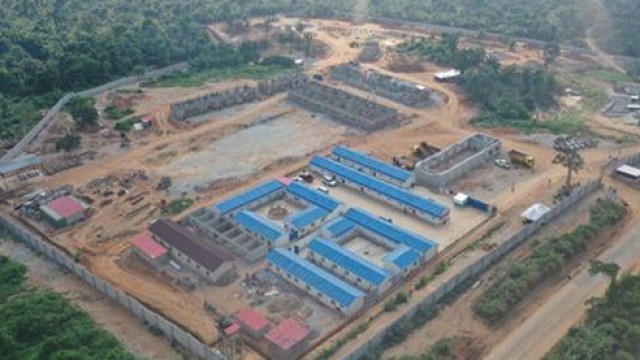
Thor Explorations reports 'milestone' second quarter; posts net profit of over US$6M
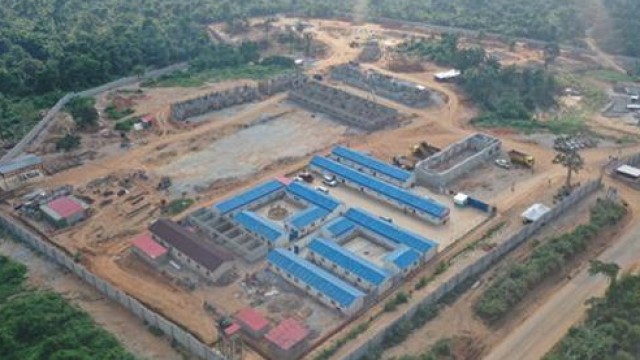
Thor Explorations reports 11% gold production increase from Segilola mine in Nigeria in second quarter
Source: https://incomestatements.info
Category: Stock Reports
